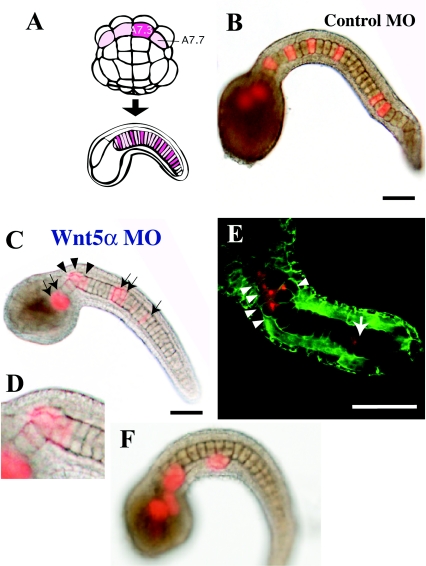
Figure 3. Effects of Wnt5α MO injected into a notochord precursor blastomere of the 64-cell embryo.
(A) Lineage illustration of notochord. Four pink blastomeres of the 64-cell embryo (vegetal view, anterior is up) give rise to the major part of the notochord in the tail. A7.3 and A7.7 are the notochord precursors. Each blastomere divides three times and gives rise to eight notochord cells randomly intercalated in the notochord. Injected blastomeres and their descendants are indicated in dark pink. (B) Tail-bud embryos co-injected with the lineage tracer and control universal MO into the A7.3 blastomere. The dark spot in the centre of each notochord cell is the nucleus. (C) Injection of Wnt5α MO. Arrows indicate normally intercalated notochord cells that are labelled with red fluorescence. Arrowheads show cells that failed to intercalate. (D) Closer view of the neck region of (C). (E) Another example of injection of Wnt5α MO observed with a confocal microscope. Cell boundaries are demarcated by green fluorescence. (F) Embryos that showed a severe phenotype. Labelled notochord cells are clustered and not incorporated into the aligned notochord. Scale bar, 100 μm.

