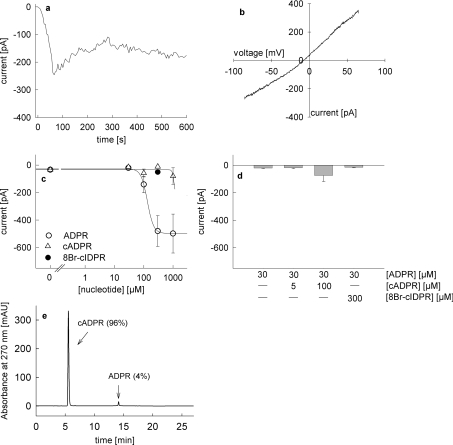
Figure 10. Activation of endogenous TRPM2 currents in Jurkat T-cells by infusion of ADPR, cADPR and 8-Br-N1-cIDPR.
All experiments were carried out with 2 mM extracellular Ca2+ and with unbuffered intracellular Ca2+ as described in [35]. Voltage ramps from −85 mV to +65 mV were applied every 5 s. (a) Representative membrane current over time recorded at −80 mV induced by perfusion with 300 μM ADPR. (b) Representative current–voltage relationship derived from currents evoked by voltage ramps from −85 mV to +65 mV. (c) Concentration–response relationship for activation of TRPM2 currents by infusion of ADPR (○, n=6–8), cADPR (▵, n=5–8) and 300 μM 8-Br-N1-cIDPR (●, n=6). Results represent means±S.E.M. of maximum current at −80 mV. (d) TRPM2 currents at −80 mV after infusion of 30 μM ADPR (n=8), co-infusion of 5 μM cADPR and 30 μM ADPR (n=9), 100 μM cADPR and 30 μM ADPR (n=8), and 300 μM 8-Br-N1-cIDPR and 30 μM ADPR (n=6). Results represent means± S.E.M of maximum current at −80 mV. (e) RP-HPLC analysis of cADPR used in the infusion experiments.

