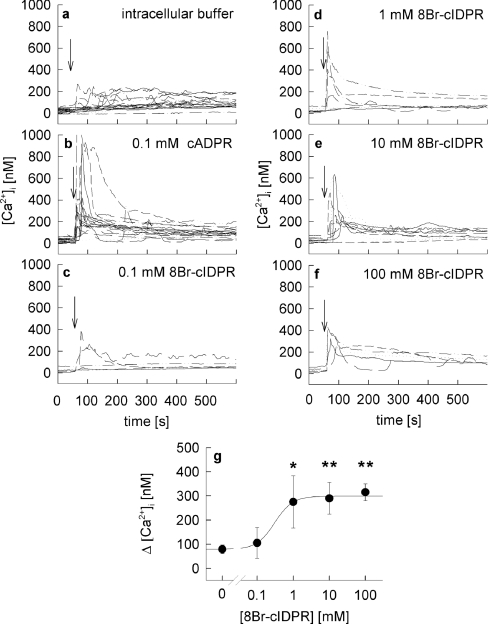
Figure 2. Microinjection of 8-Br-N1-cIDPR in intact Jurkat T-cells.
Jurkat T-cells were loaded with Fura-2AM and subjected to combined Ca2+ imaging and microinjection. Time points of microinjection are indicated by arrows. Cells were microinjected (a) with intracellular buffer (n=21) or (b) or 100 μM cADPR, (n=20) as controls or with (c) 0.1 mM (n=6), (d) 1 mM (n=7), (e) 10 mM (n=10) or (f) 100 mM (n=5) 8-Br-N1-cIDPR. (g) Concentration–response curve of 8-Br-N1-cIDPR. Results are shown as means±S.E.M. (n=5–21) of single tracings from time points 50–100 s (the Ca2+ peak). *, P<0.01; **, P<0.001 (t test).

