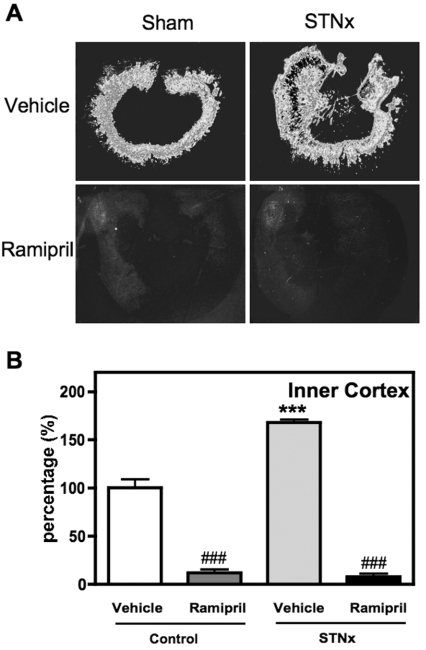
Figure 2. Localization and quantification of ACE radiolabelling in the rat kidney in Control or STNx rats with vehicle or ramipril treatment.
(A) In vitro autoradiograph showing ACE radiolabelling in the rat kidney. The white colour denotes the highest density of labelling, whereas the black colour represents background labelling. Sections from Control (Sham) rat kidney and STNx kidney without and with ramipril treatment are shown. In the Control kidney, there is abundant ACE radiolabelling of the inner cortex and outer stripe of the outer medulla. STNx increases ACE radiolabelling, which was reduced by ramipril. (B) Relative quantification of ACE radiolabelling in the inner cortex of the rat kidney expressed as a percentage of that in Control rats. ***P<0.001 compared with Control vehicle ###P<0.001 compared with appropriate vehicle-treated rats (n=5/group).

