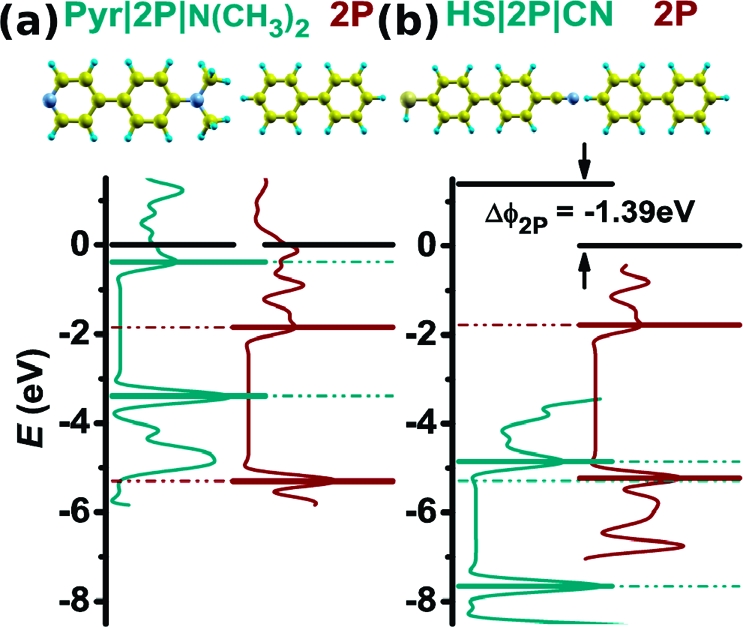
Figure 4.

Energy level schemes for the organic/organic interfaces Pyr|2P|N(CH3)2∥2P (a) and HS|2P|CN∥2P (b) in the absence of the substrate metal. The density of states projected onto the SAM and 2P atoms is shown around the band gap (cyan and red curves); the HOPS and LUPS are drawn as horizontal lines. The black horizontal lines show the vacuum levels at the substituent side of the SAM before 2P deposition (left part of each plot) and at the 2P side in the SAM∥OSC system (right part). The latter is set as the origin of the energy axis. ΔΦ2P denotes the step in the electron electrostatic potential due to contact between the layers in analogy to the work-function changes in 2.
