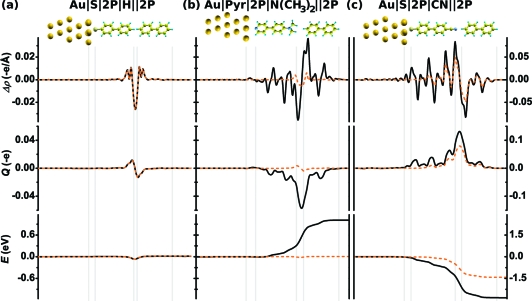
Figure 6.
Plane-integrated charge rearrangements, Δρ, per unit cell (topmost panels), cumulative charge transfer along the z-axis per unit cell, Q (middle panels), and change in the potential energy of an electron, E, upon addition of 2P to the system (bottom panels) for systems 7 (a), 1 (b), and 11 (c); Δρ > 0 indicates an increase of the electron density, and Δρ < 0 a decrease. Black lines show the results for the addition of 2P to a metal|SAM systems, dashed orange lines for the pure SAM∥2P interfaces. The y-scales in (c) differ by a factor of 2.5 from the respective scales in (a) and (b). Vertical lines and schematic pictures of the systems in the background serve as guides to the eye.

