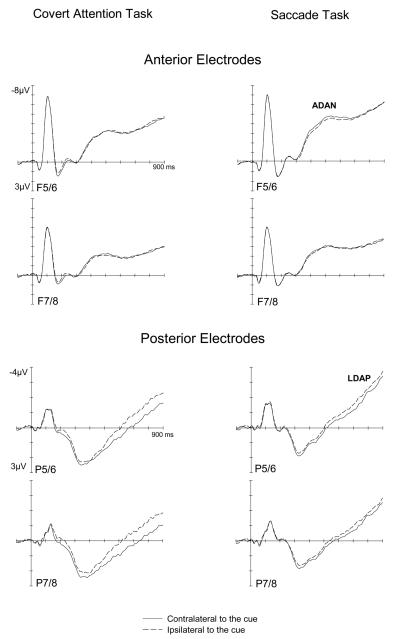
Figure 2.
Grand-averaged ERPs elicited during the S1-S2 interval in the 900 ms following onset of the symbolic cue (S1), relative to a 100 ms baseline, for anterior (top panel) and posterior (bottom panel) electrodes ipsilateral (dashed lines) or contralateral (solid lines) to the cued side, shown separately for the Covert Attention task (left) and the Saccade task (right).

