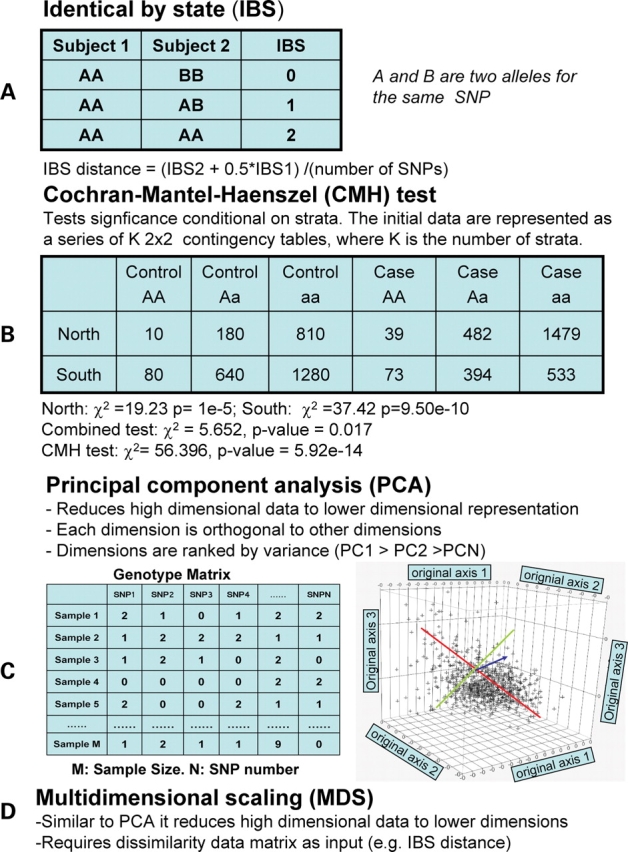
Figure 2.

Definition of statistical terms and tests. (A) Schematic of how identical by state distance is measured. (B) An example of the application of the Cochran–Mantel–Haenszel (CMH) test. In this example, two strata (North and South) are defined. These strata (K) can be determined using some methodology (e.g. clustering algorithm). The method assumes that each stratum has the same odds ratio. In this example the A allele has an odds ratio of 1.5. The substantial gain in power is illustrated by comparing CMH test result with the combined data. (C) The features of PCA; the high dimensional data shown in the genotype matrix (M × N) is reduced to orthogonal dimensions with the largest variance in PC1 represented by the red line. (D) The features of MDS are shown.
