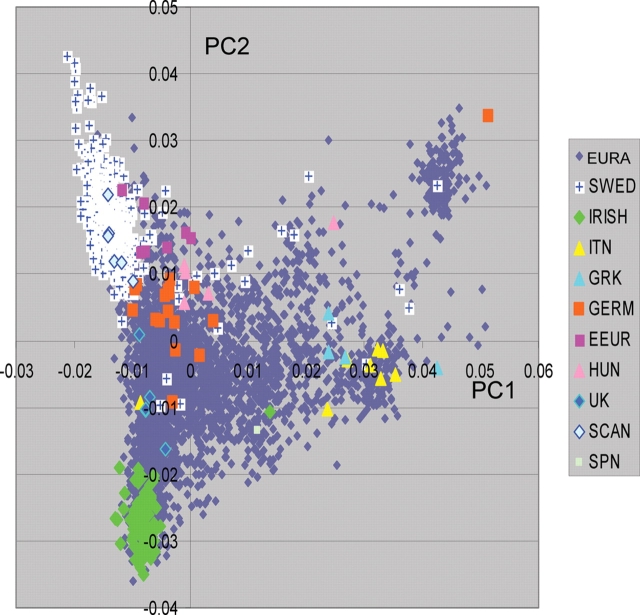
Figure 3.
European Population Substructure. The first two principal components are shown for a diverse group of >3000 European and European American subjects. The clustering of different groups within Europe is shown for each individual designated by a symbol. The subjects from specific countries of origin or with four grandparental defined European countries of origin are color coded as shown in the legend with grey symbols indicated European Americans (EURA) with insufficient country of origin information. The groups from the following countries or regions are included: Sweden (SWED), Ireland (IRISH), Italy (ITN), Greece (GRK), Germany (GERM), Eastern Europe (EEUR), Hungary (HUN), United Kingdom (UK), Scandinavia (SCAN), and Spain (SPN). Although not included in this figure, additional studies indicate that the cluster in the right upper quadrant corresponds to an Ashkenazi Jewish grouping.

