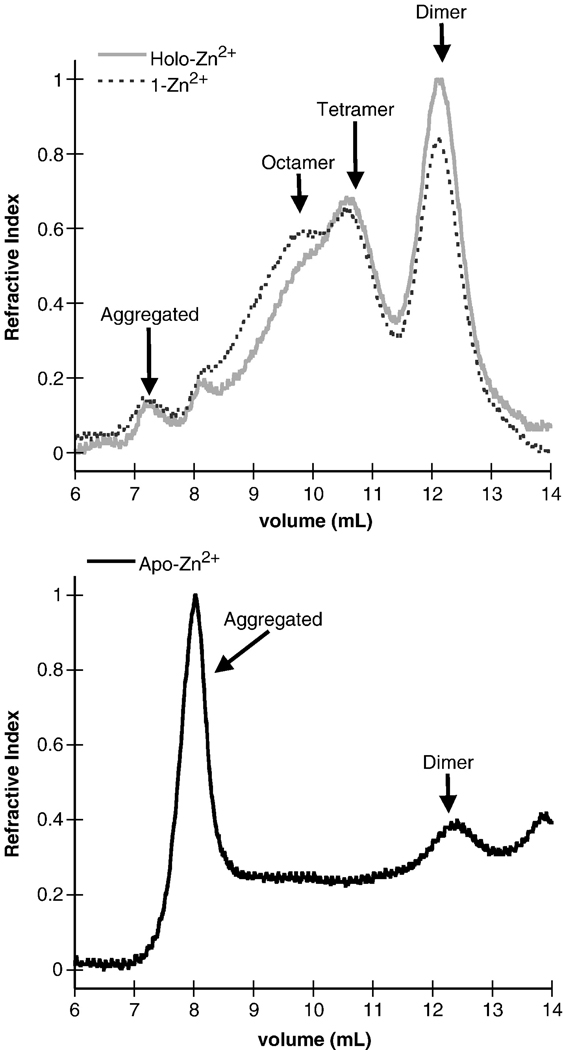
Figure 2.
Size exclusion chromatography profiles of holo-Zn2+ and 1-Zn2+ (top panel), and apo-Zn2+ (bottom panel) forms of mR1(core). The chromatographic profiles are from an analytical 20 ml Superdex 200 column and monitored by refractive index. Refractive index values were normalized with respect to the total concentration of holo-Zn2+ mR1(core) and are in arbitrary units.

