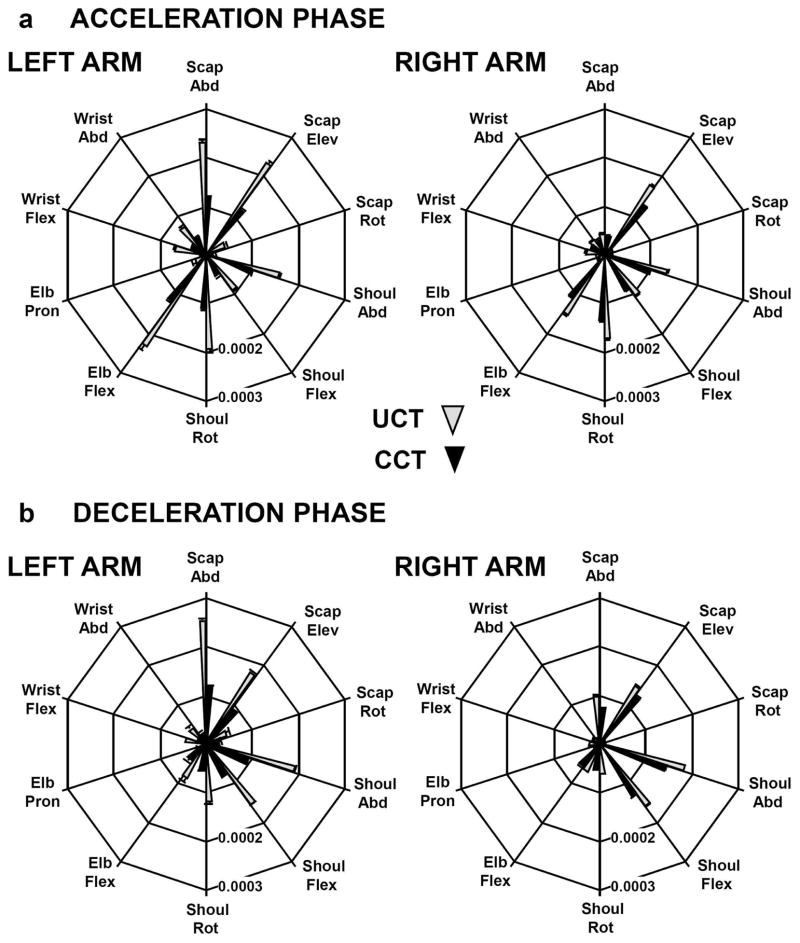
Fig. 7.
Contribution of the individual joints to the joint variance component (VORT) that led to pointer-tip directional variability is depicted in polar plots. Variance, in rads2, is zero at the origin and increases outward to a maximum, which represents the across-subject averaged value for each condition (UCT, gray; CCT, black). Results for the acceleration movement phase are presented in A; those for the deceleration movement phase are displayed in B.

