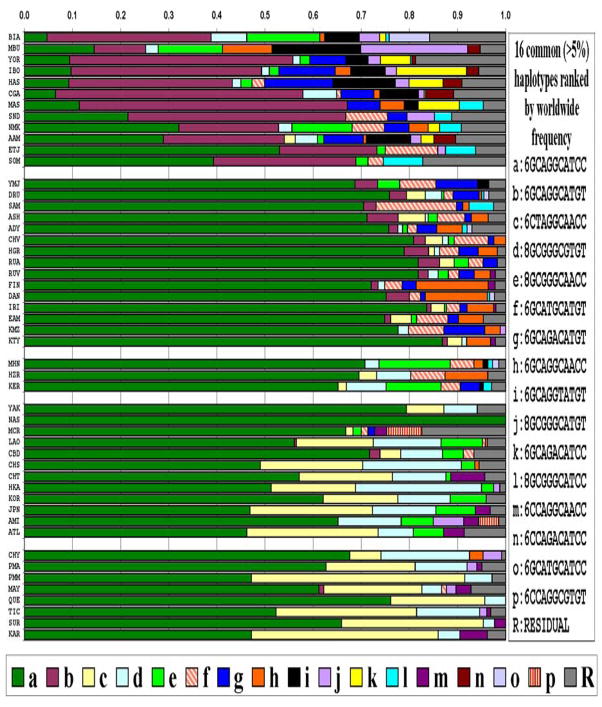
Figure 2.
Frequencies for the haplotypes based on 11 markers at CYP2E1 for 50 populations. For each color-coded haplotype the alleles are shown for the sites in chromosome order as numbered in Table 1. Both the full allelic description and lower-case letter codes for the haplotypes are given. For each population the proportional length of each color bar represents the frequency of the respective haplotype. All haplotypes that have frequencies less than 5% in all the populations studied are grouped into the residual (gray bar) class. The ancestral haplotype, GCAGGCAAGC, for markers 2 through 11, is not found at common frequencies in any of the 50 populations studied.

