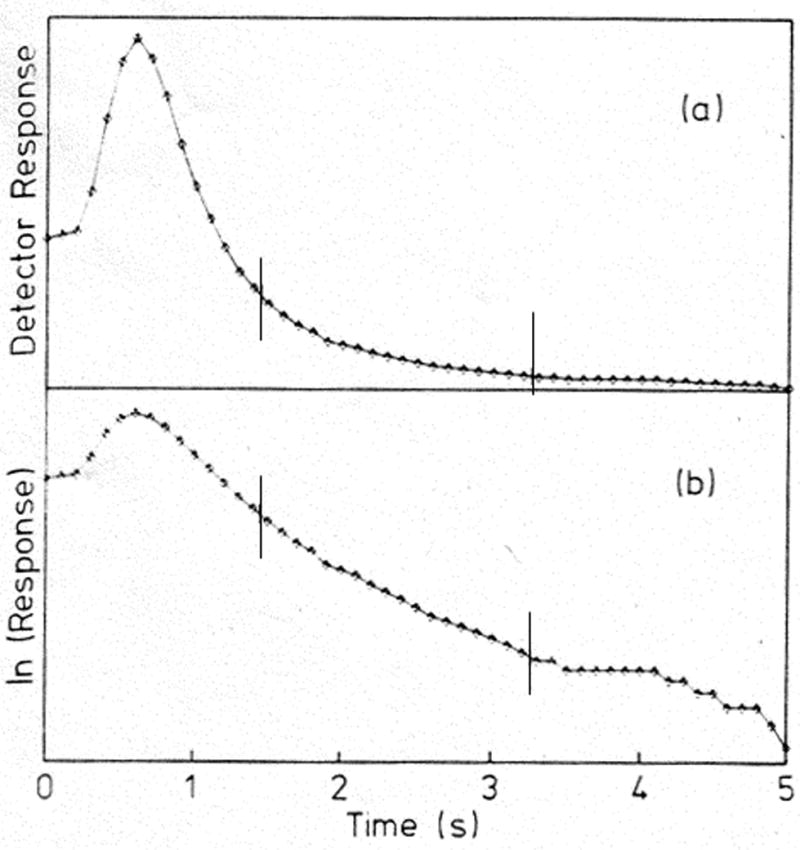
Figure 10.

Examples of (a) a typical peak decay curve and (b) a logarithmic transform of this curve as determined for elution of the sugar methylumbilliferyl α-D-mannopyranoside (MUM) from an immobilized concanavalin A column after a step change was made to the continuous application of 0.1 M mannose as a competing agent. These chromatograms were collected on a 6.3 mm × 2.1 mm i.d. column at 10 mL/min. The slope of the curve in (b) was analyzed according to Eq. (13) to obtain the dissociation rate constant for MUM from this column. (Adapted with permission from Ref. [36])
