
Figure 2.
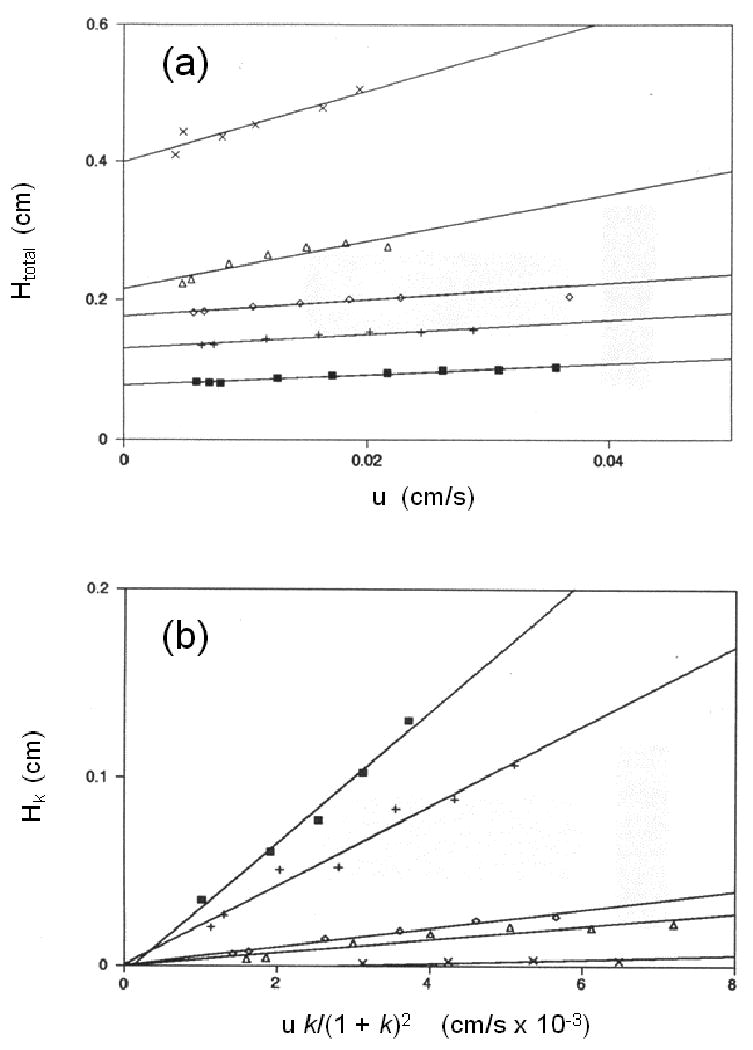
Typical results obtained in the plate height method at several temperatures for (a) plots of the total plate height (Htot) versus linear velocity (u) for the injection of R-warfarin onto an immobilized HSA column, and (b) the corresponding plots of the plate height contribution due to stationary phase mass transfer (Hk) versus u k/(1+k)2 after correcting the data for other band-broadening contributions. (Adapted with permission from Ref. [31])