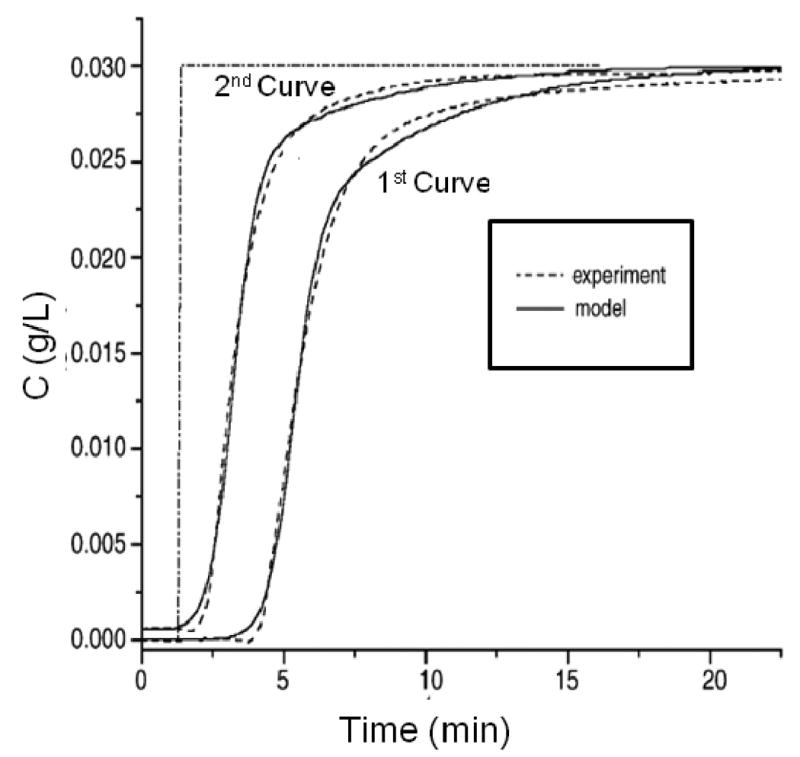
Figure 6.

Comparison of two sequential breakthrough curves for the binding of β-lactoglobulin to an affinity column containing antibodies against this agent. The dashed lines show the experimental data and the solid lines show the results obtained through peak fitting to a bi-Langmuir kinetic model. Each curve in this figure begins when a step change is made to apply a sample solution to the column. (Adapted with permission from Ref. [42])
