
Figure 7.
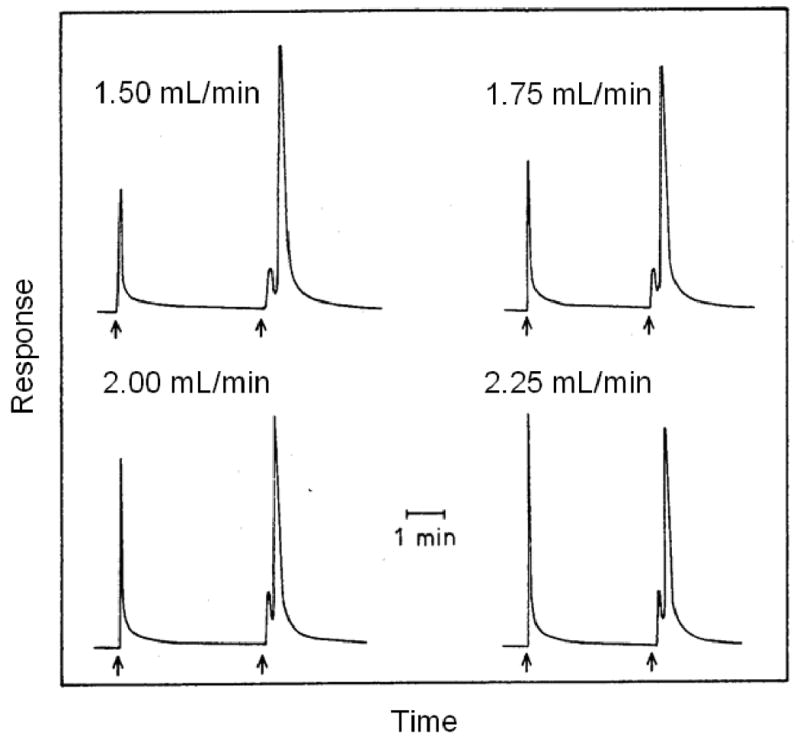
An illustration of the split-peak effect, as observed during the injection of rabbit IgG onto an immobilized protein A column at several flow rates. The sample was injected at the first arrow in each chromatogram and the retained analyte was eluted by a pH change at the second arrow. (Adapted with permission from Ref. [83])