
Figure 5.
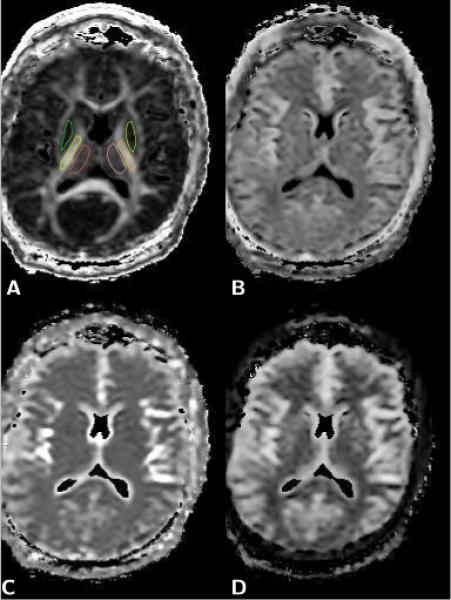
Axial brain diffusion data maps. A) Fractional anisotropy (FA) map, which was used to define the regions of interest (ROI) for right and left thalamus (red, pink), putamen and globus pallidum (green, light green), and internal capsule (yellow, orange). B) Map of the relative size fraction of the slow diffusion component, fs. C) Map of the fast diffusion coefficient, Df. D) Map of the slow diffusion coefficient, Ds. The elevated values of the slow diffusion coefficient observed in the putamen/globus pallidum and thalamus (see Table 1) are clearly evident on the slow diffusion component map shown in D, whereas the same areas appear no different from white matter in the map of the fast diffusion coefficient (C) and the map of the relative size fraction of the slow diffusion component (B).