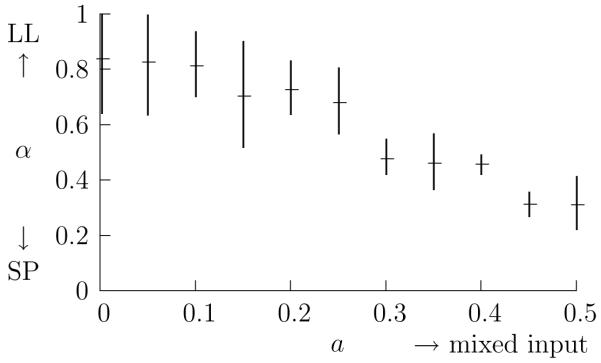
Figure 2.
The optimal α plotted against a. The value of metric parameter α giving the maximum h is plotted for different values of the mixing parameter a. For each value of a the best value of α has been found for 20 different runs, the average is marked and the error bars give one standard deviation.

