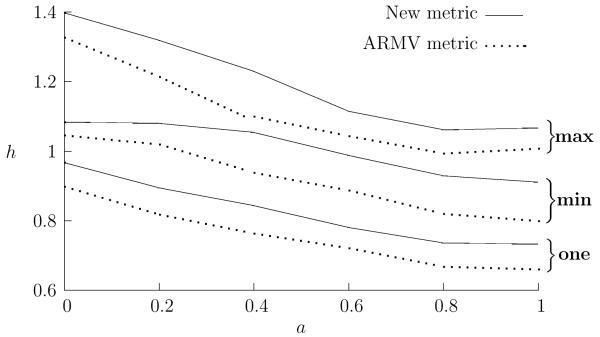
Figure 3.
The relative performances of the different metrics. The best and worst value of h over the parameter range is plotted against a, the mixing parameter. For each value of a, h was calculated for different values of the metric parameter, α ∊ [0, 1] for the new metric and k ∊ [0, 2] for the ARMV metric. The best and worst values are marked max and min in the graph, the average h value calculated using the responses of each of the two neurons taken on its own is also shown and is marked one. For the single unit examples, the new metric reduces to the van Rossum metric and the ARMV to the Victor-Purpura metric. All values have been averaged over 20 runs.

