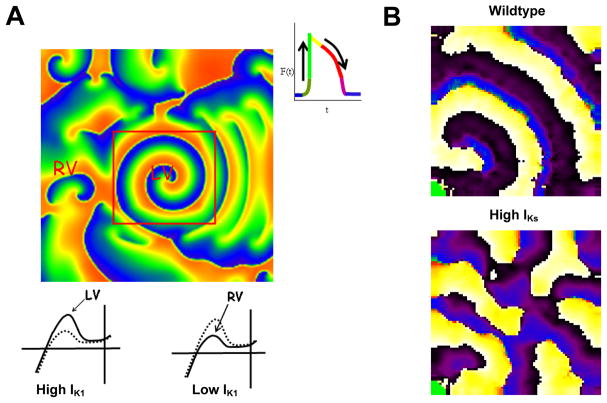
Figure 3.
A, IK1 and IKs have different roles in VF dynamics. A. Role of IK1 density in VF dynamics in a 2-D model (6×6 cm2) of the guinea pig ventricles consisting of >200,000 excitable elements (“cells”). The simulated left ventricle (LV, center) is surrounded by the right ventricle (RV, periphery). Top, phase map of VF maintained by a stable rotor in the LV, with fibrillatory conduction to RV. Red square shows the perimeter of the LV model (area, 2×2 cm2). As illustrated by the inset on the right, each color represents a different phase of the action potential in each cell. Bottom, current-voltage (IV) relations of IK1 used for LV (left) and RV (right). Note larger IK1 density in LV. Broken curve is IK1 with nominal density. For further explanation see text and ref13. B, IKs, Overexpression results in fibrillatory conduction even when IK1 is normal. Top, single rotor in wildtype monolayer. Bottom, multiple wavebreaks and fibrillatory conduction in monolayer overexpressing IKs. See ref24 for details.

