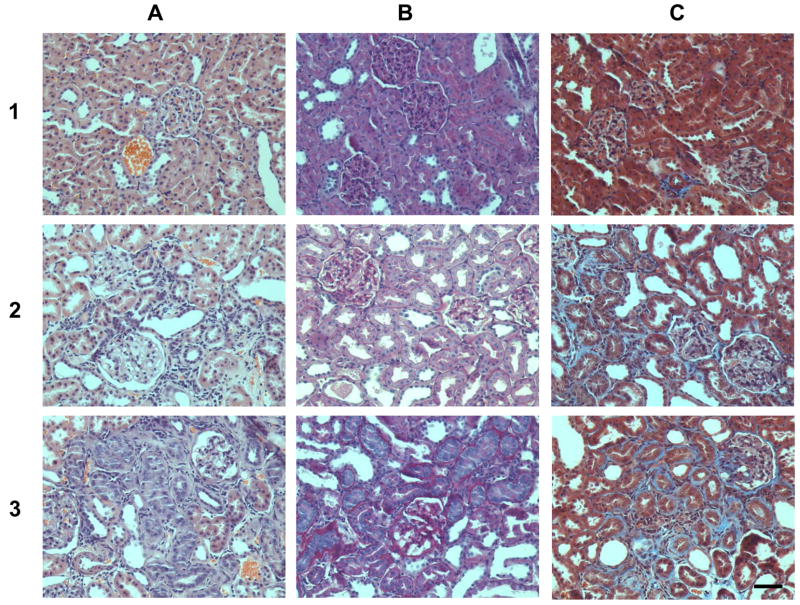
Figure 7. Representative renal images with different grades of nephropathy. Column A: hematoxylin and eosin stain; column B: PAS stain and C: trichrome stain.
Row 1: sections from a female at 6 weeks on the regular diet; Row 2: sections from a female at 20 weeks on the AO diet. In this group there is an increase of PAS positive stain in the mesangium as well as in the basement membrane, the fibrosis in the interstitium is score 1. Row 3: sections from a female at 20 weeks on the regular diet. Glomerulosclerosis and alterations in the tubules and interstitium (score 2) are higher in females at 20 weeks on the regular diet. Magnification 200×, bar = 50 μm.

