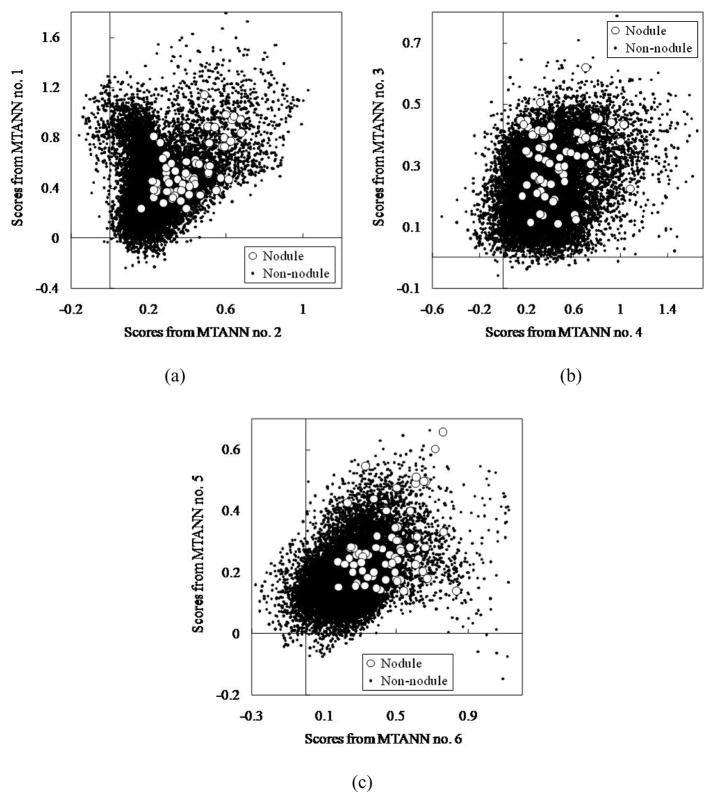
Figure 8.
Distributions of scores from the 6 classification-MTANNs for 67 nodules (white circles) and 13,688 non-nodules (black dots) detected by the lesion-enhancement MTANN filter followed by thresholding. (a) Distributions of scores from classification-MTANN nos. 1 and 2. (b) Distributions of scores from classification-MTANN nos. 3 and 4. (c) Distributions of scores from classification-MTANN nos. 5 and 6.

