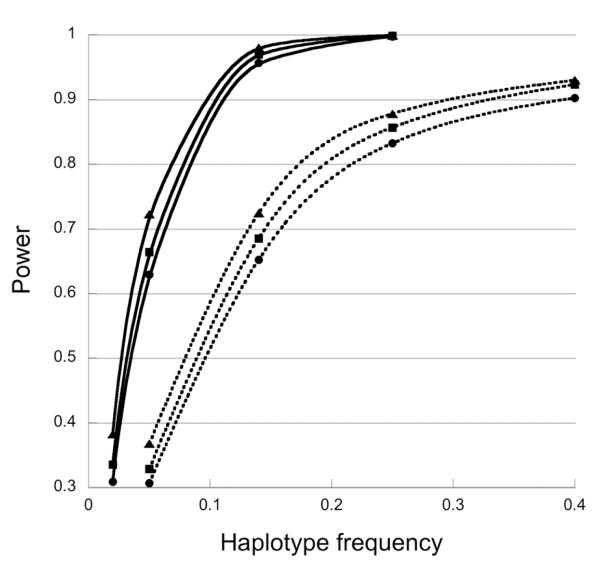
Figure 1.
Power of the one-degree-of-freedom likelihood ratio tests for offspring genetic effects as a function of the risk haplotype frequency. The one-degree-of-freedom likelihood ratio test is based on a log-linear model enforcing random mating and modeling risk with R2= R12 but distinct S1 and S2. Data were simulated under HWE and with , R2=2, S1= S2=1. Solid and dotted lines represent simulations with 400 and 1000 triads per dataset, respectively. Symbols: ▲, no missing data; ■, 20% of SNP genotypes are missing randomly; ●, both 20% of SNP genotypes are missing randomly and 20% of triads are missing the father.

