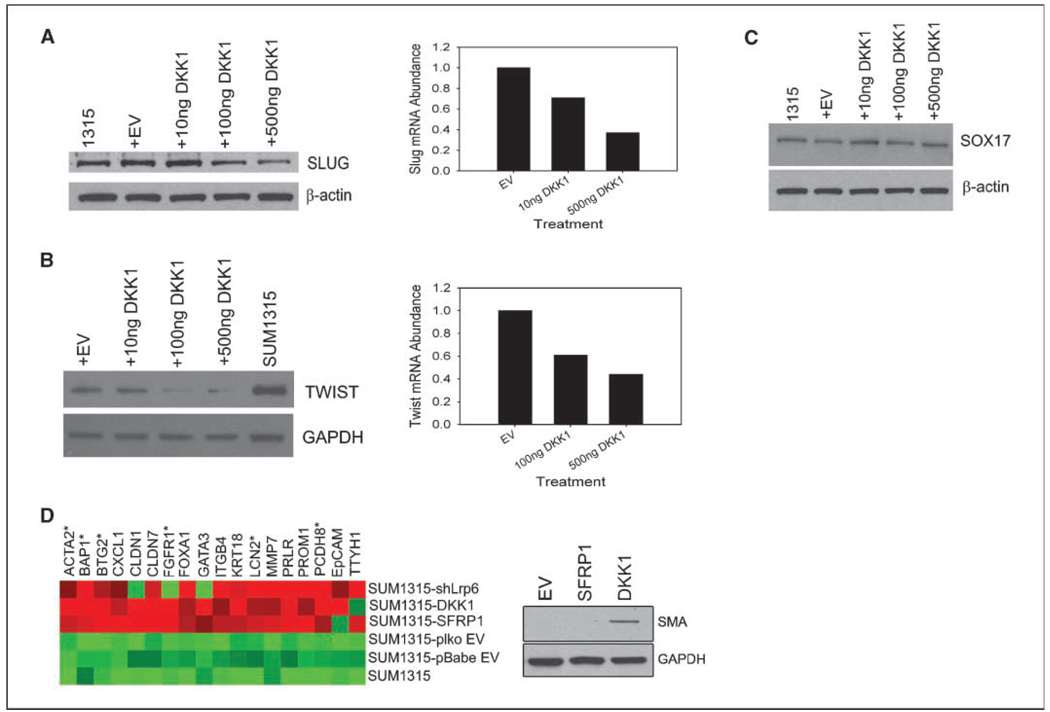
Figure 4.
Wnt signaling represses differentiation. Western blot and qRT-PCR analysis for Slug (A), Twist (B), and SOX17 (C) in SUM1315 cells transfected with DKK1. D, differential gene expression of differentiation genes from wnt-inhibited cell lines. Heatmap Builder Software was used to analyze the data. Starred (*) genes represent those of myoepithelial differentiation, whereas unstarred genes represent luminal differentiation. Western blot analysis of α-smooth muscle actin expression in Control-SUM1315, SFRP1-SUM1315, and DKK1-SUM1315 cells to confirm the qRT-PCR results from left.

