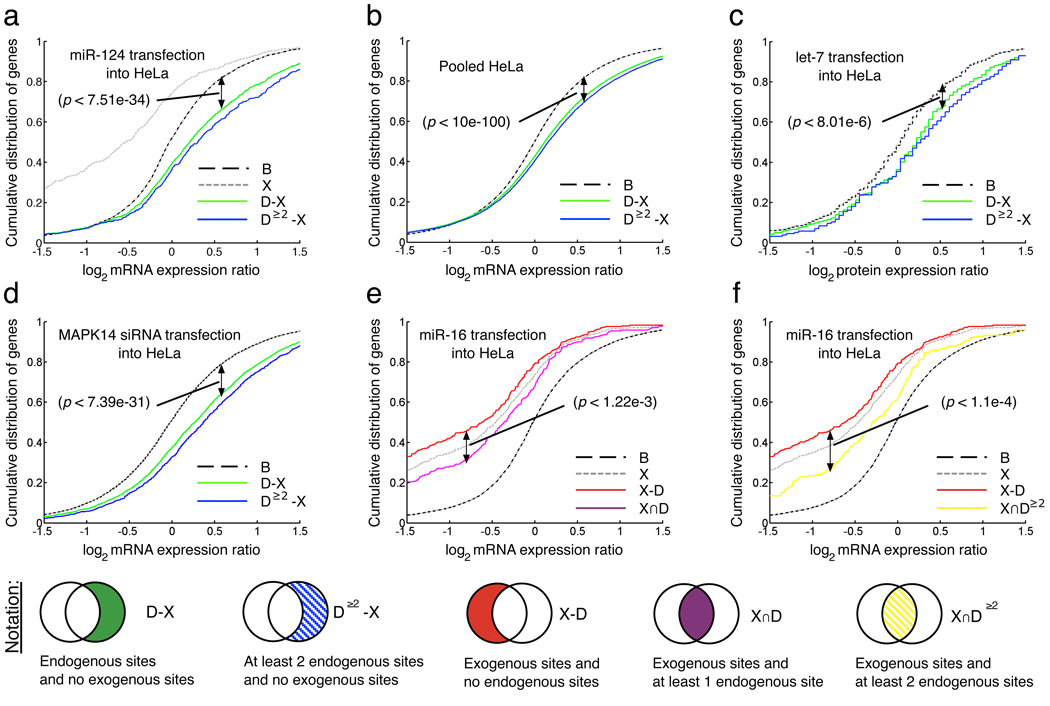
Figure 2. Genes with predicted target sites for endogenous miRNAs are significantly dysregulated after si/miRNA transfections.
Visual representation of gene sets tested for significance in expression changes against baseline (B). X is the set of genes with (predicted) sites for exogenous si/miRNAs, D–X is the set of genes with (predicted) sites for endogenous miRNA and no (predicted) sites for exogenous si/miRNAs. p-values shown are calculated by one-sided KS test as described in Methods. a. miR-124 transfection results in up-shift in gene expression for D–X with respect to baseline. b. Pooled data from 15 miRNA transfections into HeLa cells; miR-373, miR-124, miR-148b, miR-106b, miR-124, mut9-10, miR-1, miR-181, chimiR-124-1, chimiR-1-124, miR-16, mir-34a, mir-34b, miR-128a, and miR-9. c. Protein expression changes after let-7b transfection. d. mRNA expression changes after MAPK14-siRNA is transfected into HeLa cells showing upregulation of genes with sites for endogenous miRNAs (green line) [19];
e., f., Genes which contain sites for both endogenous miRNA and transfected small RNAs are less downregulated than if they contain only sites for transfected small RNAs. Changes in gene expression after miR-16 transfections, where p-values shown are calculated by one-sided KS test as described in Methods. e. X–D is the set of genes containing exogenous sites and no endogenous sites. X∩D is the set of genes with sites for both endogenous and exogenous miRNAs. f. X–D≥2 is the set of genes containing exogenous sites but less than 2 endogenous sites. X∩D is the set of genes with sites for both endogenous and exogenous miRNAs.

