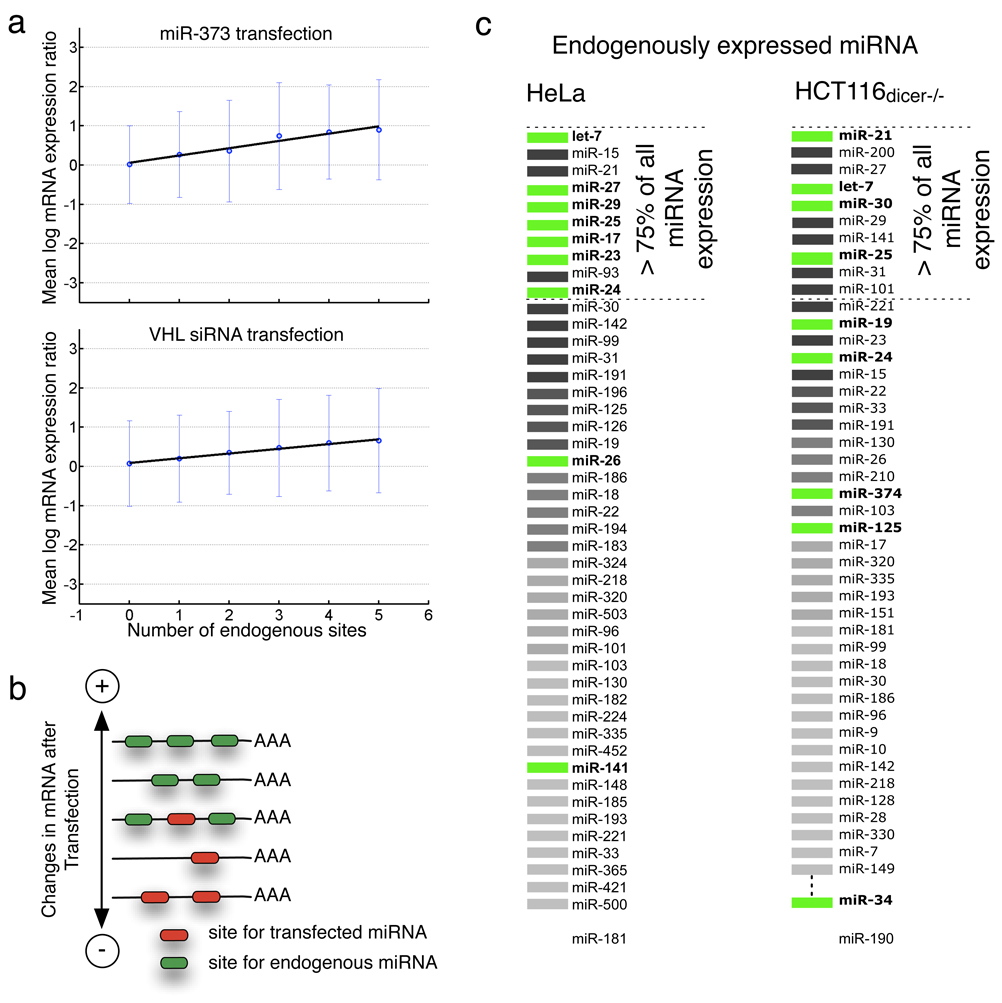
Figure 3. Quantitative model predicting expression change after transfection.
a. Linear regression fitting mean log(expression change) to number of endogenous sites in genes having no exogenous sites, in miR-373 and VHL-siRNA experiments (respectively). One standard deviation from mean depicted with error bars.
b. Cartoon graph of genes with different combinations of sites showing net effect on gene expression.
c. The relative rank of the ten miRNAs that occurred most often with positive regression coefficient in stepwise regression models for >20 HeLa and 16 HCT116 Dicer−/− transfection experiments (see Methods). These miRNAs can be interpreted as a predicted endogenous profile. The true endogenous HeLa and HCT116 Dicer−/− profile is shown, with miRNAs ranked in order of endogenous expression. Correctly predicted endogenous miRNAs are shown in green and other endogenous miRNAs in black-grey; white indicates a miRNA predicted through regression analysis and not expressed endogenously.

