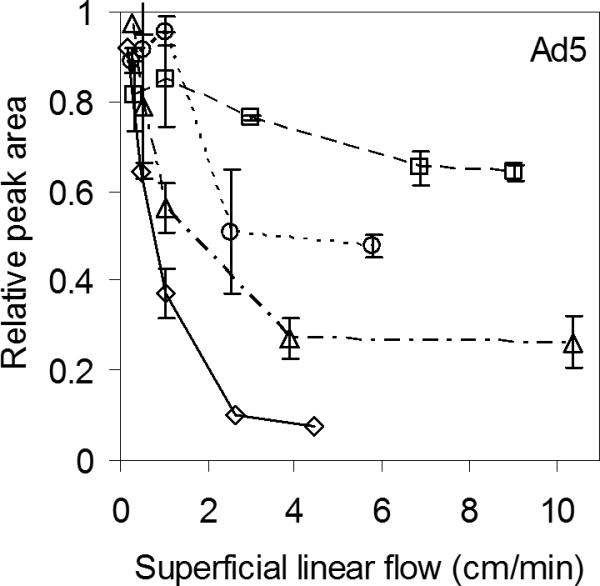
Fig 3.

Decrease in Ad5 peak area with increasing flow rate on the three monoliths, 4 CIM disks (—◇—), ProSwift (- -□ - -), Uno Q (- · Δ - ·), and on the perfusive resin, PL-SAX (····○····). Error bars represent one standard deviation based on replicates (n=2-3). Same pulse and background as in Figure 2.
