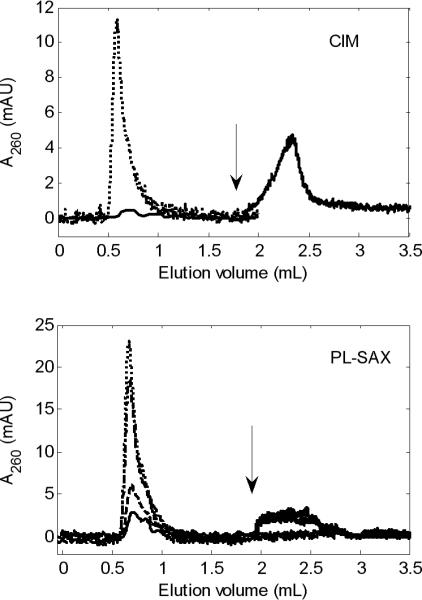
Fig 5.

Ad5 pulse on 4 CIM disks (top) and on PL-SAX (bottom). In the top panel, us = 0.18 cm/min (Pe ≈ 0.12; ········) and 4.4 cm/min (Pe ≈ 3.1; —). In the lower panel, us = 0.25 cm/min (Pe ≈ 0.041; ········), 1 cm/min (Pe ≈ 0.16; - · -), 5.8 cm/min (Pe ≈ 0.93; - - -), and 10 cm/min (Pe ≈ 1.6; —). The arrow indicates where the flow rate was reduced to the lowest value. Same pulse and background as in Figures 2-4.
