
Figure 2. miR-126 suppresses overall tumour growth and proliferation whereas miR-335 and miR-206 regulate migration and morphology.
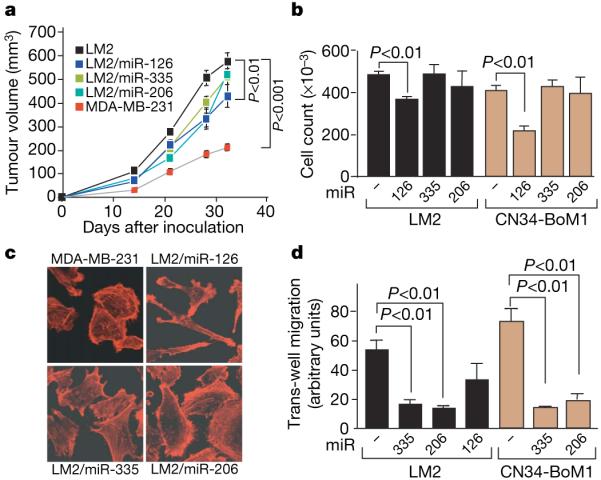
a, 5 × 10⁵ LM2 cells expressing individual miRNAs or the control hairpin, as well as the parental MDA-MB-231 cells, were injected into the mammary fat pads of immunodeficient mice and tumour volumes were measured over time. n = 5 (MDA-MB-231, LM2/miR-126, LM2/miR-206) and n = 10 (LM2, LM2/miR-335); error bars indicate s.e.m.; P-values based on a one-sided Student's t-test at day 32. b, 5 × 10⁴ LM2 or primary breast cancer line CN34-BoM1 expressing miR-126, miR-335 or miR-206 and control cells were seeded in triplicate and viable cells were counted at 5 days after seeding. n = 3; error bars represent s.e.m.; P-values obtained using a one-sided Student's t-test. c, Parental MDA-MB-231 cells and lung metastatic LM2 cells expressing miR-126, miR-335 or miR-206 were seeded onto glass slides. Cells were stained with the actin marker phalloidin and confocal images were obtained. d, 2.5 × 10⁴ LM2 and CN34-BoM1 cells were transduced with the indicated miRNAs or a control hairpin, and trans-well migration was assessed. Images of cells that had migrated through trans-well inserts were obtained and analysed in automated fashion using Metamorph software. n = 3; error bars represent s.e.m.; P-values obtained using a one-sided Student's t-test.