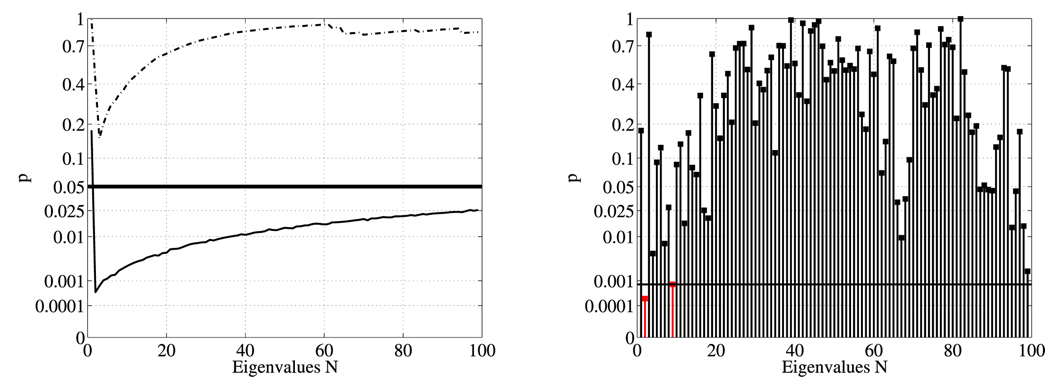
Fig. 4.
Maximum t-statistic results of area normalized case (left) for the first n eigenvalues (solid line: unsmoothed, dashed line: smoothed) and (right) for individual eigenvalues (unsmoothed case) with FDR multiple comparison correction. The black horizontal lines correspond to the 5% significance level and the 5% FDR corrected significance level respectively. The left plot shows statistical results for the analysis of shape-DNAs of different lengths. The right plot shows statistical results for individual spectral components. Since the statistically most significant eigenvalue cannot be selected after the statistical analysis, a shape-DNA-based analysis with prespecified length is useful.

