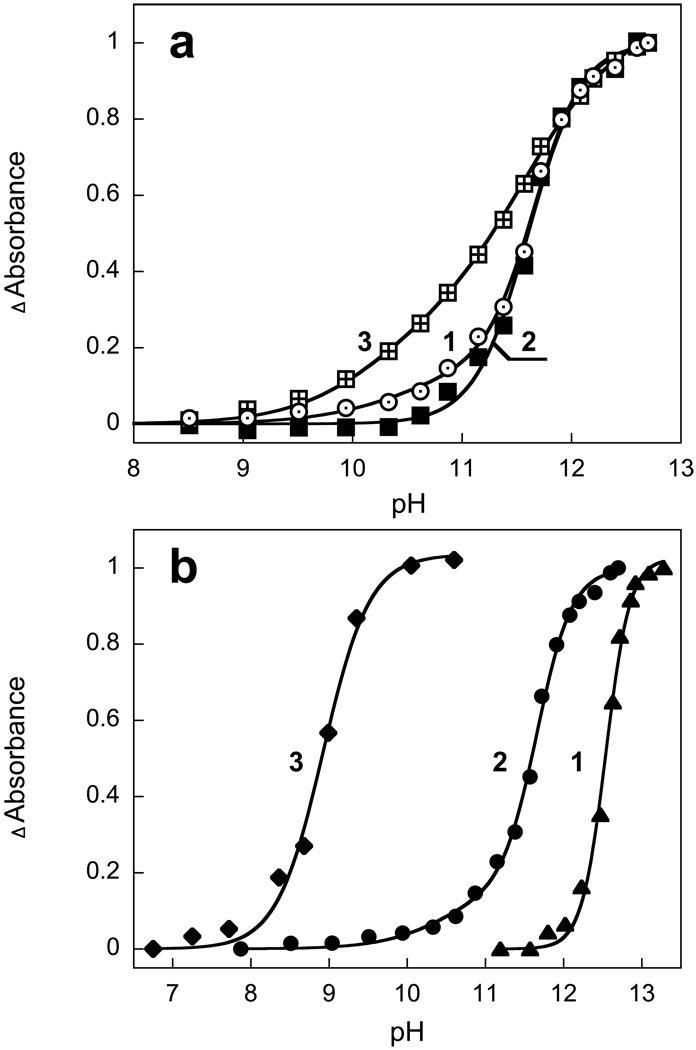
Figure 2.
a) pH dependence of absolute values of absorption changes of xanthorhodopsin in 0.15% DM, 100 mM NaCl at 573 nm (curve 1), 521 nm (curve 2) and 299 nm (curve 3). Data are from Fig. 1. The pH dependence of absorption changes at 370 nm (not shown) follows that at 573 nm within experimental error. Curves are normalized to the maximum. b) Effect of detergents on the pKa of the Schiff base deprotonation: curve 1, native cell membrane (pKa 12.4, n=3); curve 2, solubilized in 0.15% DM, 100 mM NaCl (two component fit with A1=0.15, pKa1=10.5, n=1; A2=0.85; pKa2 =11.6, n=1.9); Curve 3, solubilized in 1.5% OG, 100 mM NaCl (pKa 8.9, n=1.5).

