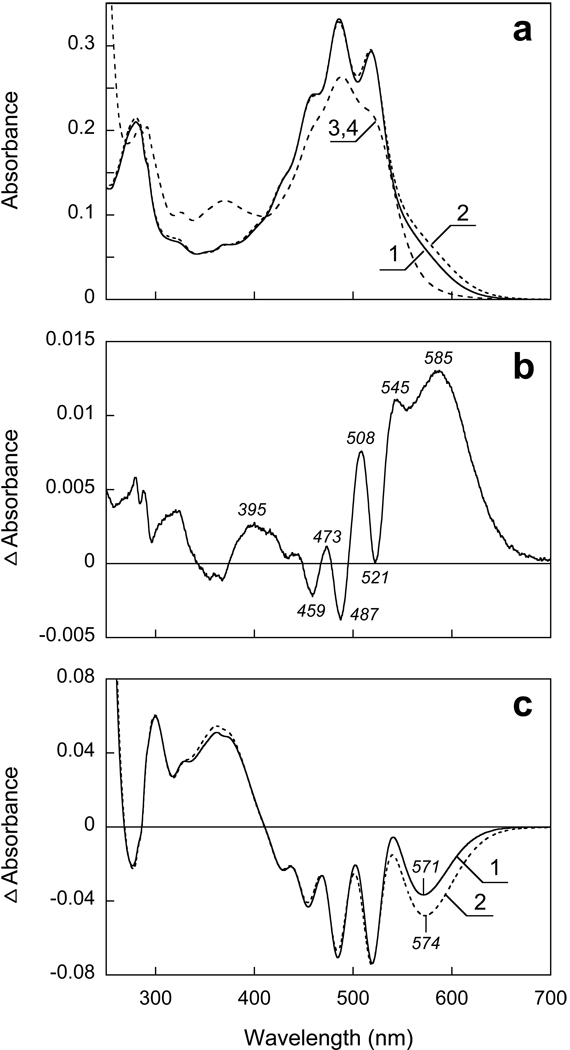
Figure 3.
pH dependence of absorption spectrum of xanthorhodopsin in DM between pH 8.5 and 4.5. a) 1 and 2, absolute spectra at pH 8.5 and 4.5; 3, 4 (coincident) after increasing the pH to 12.5 in samples 1 and 2, respectively. b) Difference spectrum “pH 4.5 minus pH 8.5”. c) Curves 1 and 2, difference spectra “pH 4.5 minus 12.5” and “pH 8.5 minus 12.5”, respectively.

