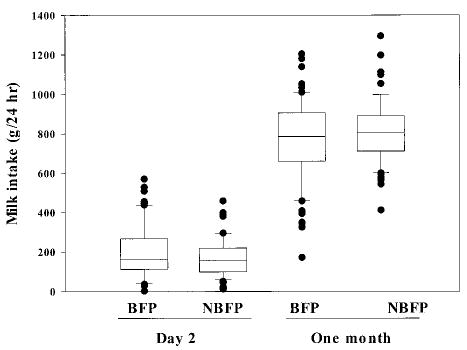
Fig 1.

Infants’ 24-hour intake of their mothers’ breast milk by presence of a breastfeeding-pregnancy overlap and day of observation. Upper and lower limits of the box represent the 25th and 75th percentile values; the horizontal line within the box represents the median. Bars represent the standard deviation.
