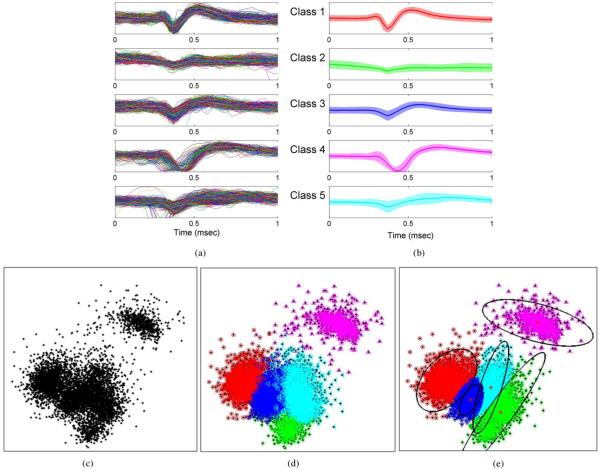
Fig. 3.
Five units obtained from spontaneous recordings in an anesthetized rat preparation. Units were chosen to posses significant correlation among their spike waveforms as seen in the PCA feature space in (c). (a) Events from each recorded unit, aligned and superimposed on top of each other for comparison. (b) Corresponding spike templates obtained by averaging all events from each unit on the left panel. (c) PCA 2-D feature space. Dimensions represent the projection of spike events onto the two largest principal components. (d) Clustering result of manual, extensive, offline sorting using hierarchical clustering using all features in the data. (e) Clustering result using the two largest principal components and EM cluster-cutting based on Gaussian mixture models. This is an example of a suboptimal sorting method with relatively unlimited computational power.

