Fig. 4.
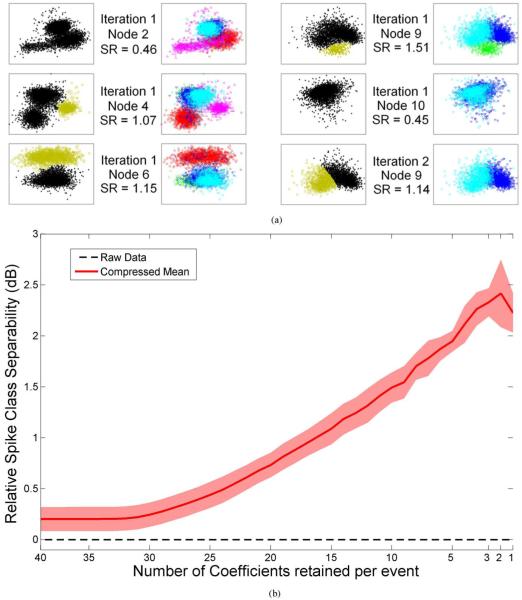
(a) Unit isolation quality of the data in Fig. 3. Each cell in the left side shows the separation (displayed as a 2-D feature space for illustration only) obtained using the compressed sensing method. The highest magnitude coefficients that survive the sensing threshold in a given node are considered irregular samples of the underlying unit’s firing rate and are marked with the “Gold” symbols in the left panel. The feature space of the sorted spikes using the manual, extensive, offline spike sorting is re-displayed in the right side (illustrated with the same color code as Fig. 3) for comparison. If a gold cluster from the left panel matches a single colored cluster from the right panel in any given row, this implies that the corresponding unit is well isolated in this node using the single feature/event magnitude alone. The unit is then removed from the data before subsequent DWT calculation is performed in the next time scale. Using this approach, three out of five units (pink, red, and green) in the original data were isolated during the first iteration in nodes 4, 6, and 9, respectively, leaving out two units to be isolated with one additional iteration on node 9’s remaining coefficients. In the first iteration, node 2 shows weak separation (SR = 0.45) between units. Unit 4 has larger separability in node 4 (SR = 1.07). Units 1 and 2 are separated in nodes 6 and 9 (SR = 1.15 and 1.51, respectively). Units 3 and 5 are separated in node 9 afterwards (SR = 1.14). (b) Quantitative analysis of spike class separability versus number of coefficients retained per event (40 coefficients retained implies 0% compression of the spike waveforms, while 1 coefficient retained implies 100% compression) (i.e., thresholding) for 24 units recorded in the primary motor cortex of anesthetized rat. A 2.5 dB (> 75%) improvement can be observed when the two most significant coefficients are averaged compared to time domain separability (Raw data).

