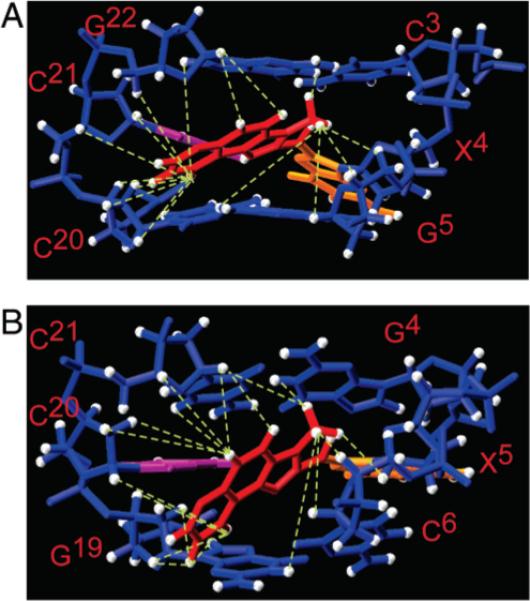
Figure 9.

Comparison of averaged refined structures, looking into the minor groove, and normal to the helix axis of the central segment: (A) NarIIQ1 duplex and (B) NarIIQ2 duplex. The NOEs defining the IQ orientation are indicated by the green dashed lines.
