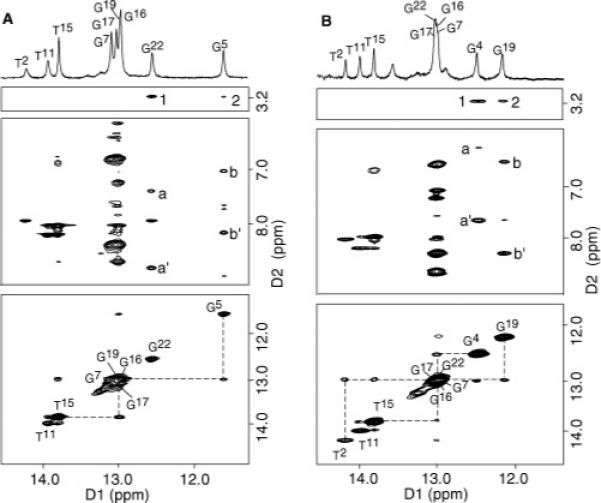
Figure 2.

Comparison of expanded plots of the imino proton region of the 1H NOESY spectra for (A) the NarIIQ1 and (B) NarIIQ2 duplexes. In the bottom panels are expanded plots showing sequential NOE connectivity for the imino protons of base pairs T2·A23 to T11·A14 at 15 °C. The labels represent the imino proton of the designated base. In the middle panels are NOE connectivities between the imino protons and the base amino protons. The NOE cross-peaks involving the imino protons are labeled in the figure as follows: (A) (a′ and a) G22 N1H → C3 NH2-4b,e and (b′ and b) G5 N1H → C20 NH2-4b,e and (B) (a′ and a) G4 N1H → C21 NH2-4b,e and (b′ and b) G19 N1H → C6 NH2-4b,e. In the top panels are NOE connectivities between the imino protons and the IQ methyl protons. The IQ-DNA cross-peaks are labeled as follows: (A) 1, G22 N1H → X4 CH3; and 2, G5 N1H → X4 CH3; and (B) 1, G4 N1H → X5 CH3; and 2, G19 N1H → X5 CH3.
