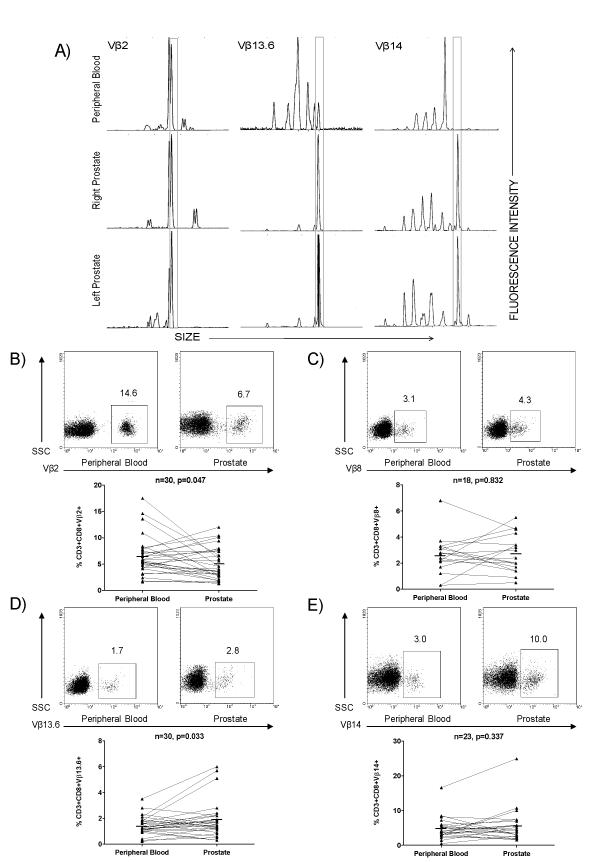
Figure 1.
TCR Vβ skewing of select Vβ families in peripheral blood and prostate of PCa patients. A) Examples of skewing observed by TCR Vβ CDR3 spectratyping. Skewed CDR3 sizes in CD8+ PIL are observed in both the right and left lobes of the prostate, but not in the peripheral blood. B-E) Positively isolated CD8+ T cells were stained directly ex vivo and analyzed by flow cytometry. Representative FACS plots of CD3+CD8+Vβ2+, CD3+CD8+Vβ8+, CD3+CD8+Vβ13.6+, and CD3+CD8+Vβ14+ T cells in peripheral blood and prostate tissue of PCa patients are shown as well as a summary of the data. Several individual patients demonstrate a relative up-regulation of a particular Vβ family within the prostate gland. P values were calculated by paired Student’s t test, two sided.

