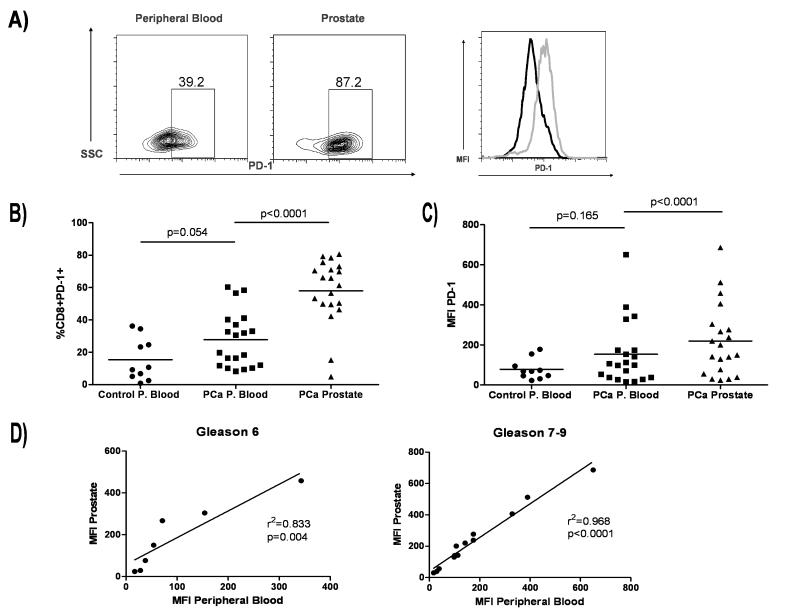
Figure 4.
Prostate-infiltrating CD8+ T cells exhibit an exhausted phenotype. A) FACS analysis of prostate-infiltrating CD8+ T cells. Plots are gated on CD8+ T cells and gates set using appropriate isotype controls. Far right, mean fluorescence intensity (MFI) comparison of peripheral blood CD8+PD-1+ T cells (black histogram) and prostate CD8+PD-1+ T cells (gray histogram). B) Summary of data above. % CD8+ T cells positive for PD-1 are shown. Bar = mean. C) Summary of data above. PD-1 MFI is shown. Bar = mean. P values were calculated for control peripheral blood (P. blood) versus PCa P. blood by unpaired Student’s t test, two sided and for PCa P. blood versus prostate by paired Student’s t test, two sided. D) Correlative analysis for PD-1 MFI for PCa P. blood versus prostate for low grade (Gleason 6) versus high grade (Gleason 7-9) disease.

