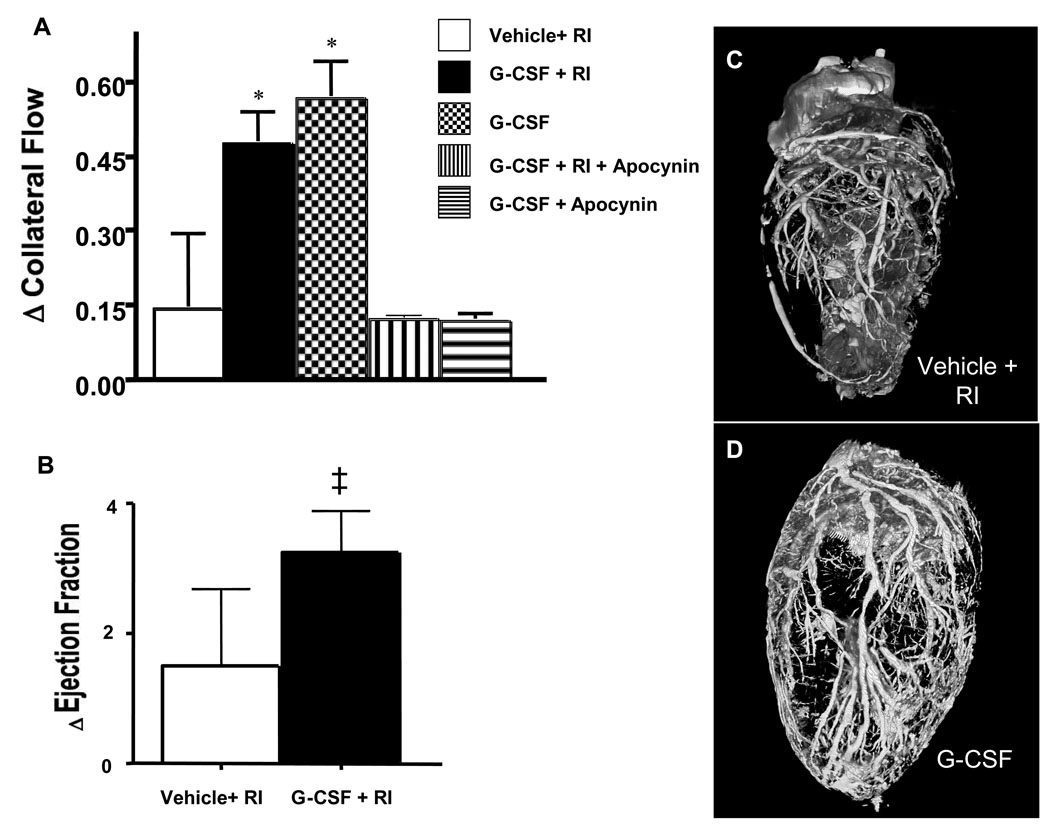
Figure 2.
A: Coronary Collateral Blood Flow (CBF) expressed as difference (delta) between relative collateral flows (collateral flow/normal zone flow) first and fifth day of RI protocol. Vehicle+RI (0.14±0.06); G-CSF+RI (0.47±0.15); G-CSF (0.57±0.18); G-CSF+ RI+Apocynin (0.09±0.01); G-CSF+Apocynin (0.09±0.02). n=6/group, *P<0.05 vs vehicle+RI. B: Change in ejection fraction (paired comparison between ejection fraction during a coronary occlusion prior to RI protocol and at Day 5 in RI+vehicle and G-CSF+RI groups). ‡ P<0.05 vs Vehicle+RI. C and D: Micro-CT images of coronary vasculature. Vehicle+RI (C) and G-CSF+RI (D).

