
Figure 2.
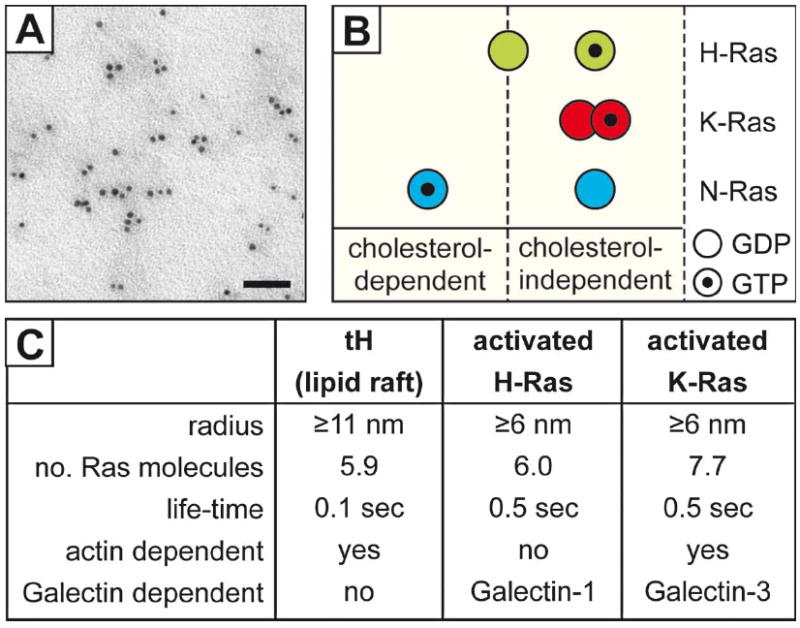
Plasma membrane Ras nanocluster parameters. EM imaging of immunogold-labeled H-Ras molecules on 2-D plasma membrane sheets (A); bar =50 nm. Ras isoforms dynamically localize to distinct signaling nanoclusters with differential cholesterol dependence (B). Other characteristics of Ras nanoclusters obtained from EM and advanced light microscopy studies are summarized in (C). This Figure is reproduced in color in Molecular Membrane Biology online.