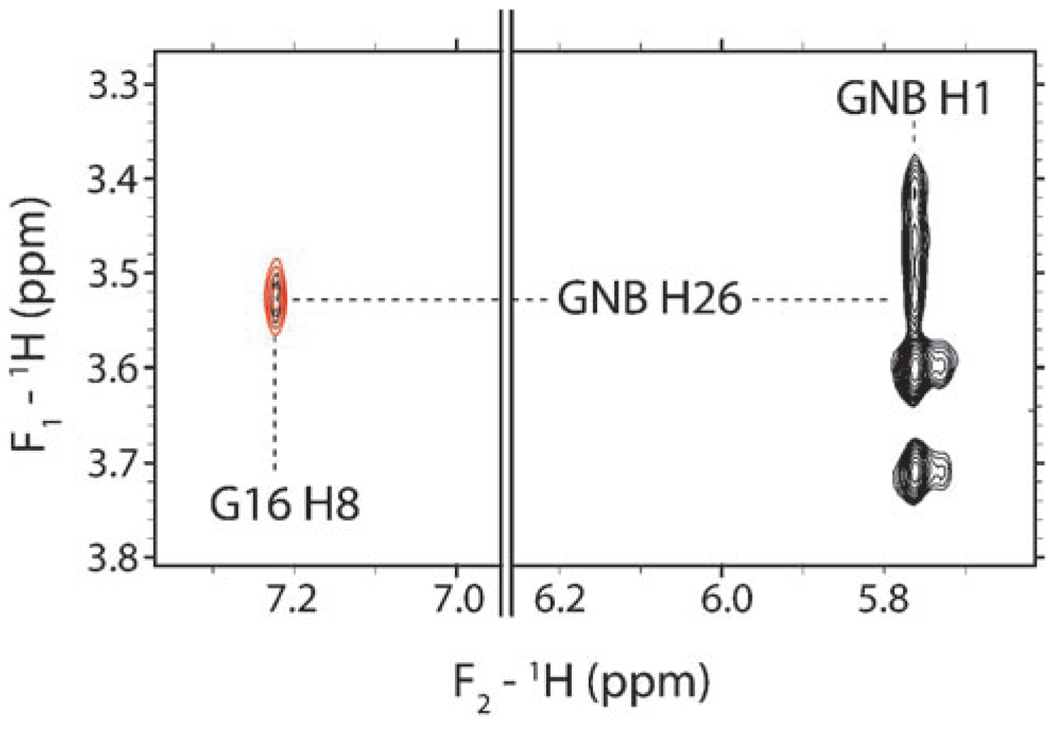
Figure 4.
1H,1H NOESY (750 MHz) of the RNA–GNB complex. An intramolecular NOE between H1 and H1′ of GNB and an intermolecular NOE between H1 of GNB and H8 of G16 of the RNA are observed (black contours). An f1-filtered/f2-edited 1H,1H NOESY spectrum is overlayed (red contours). Only intermolecular NOEs are observed in such an f1-filtered/f2-edited spectrum.

