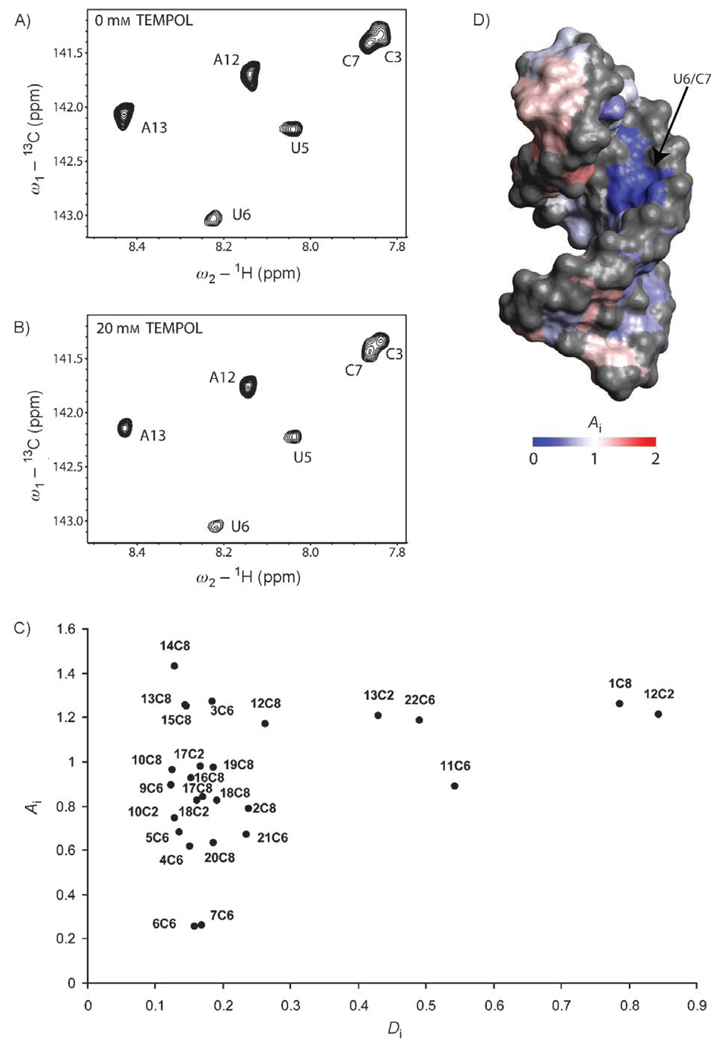
Figure 5.
Measurement of surface accessibility through paramagnetic probing. A) 1H,13C HSQC spectrum of the RNA–GNB complex. B) 1H,13C HSQC spectrum of the RNA–GNB complex in the presence of tempol (20 mm). C) Attenuation (Ai) versus atom-depth index (Di) for the complex of the frameshift-site stem loop with GNB. Di values were calculated from the structure of the free RNA. D) Surface representation of the structure of the frameshift-site stem loop. The RNA is colored according to the degree of attenuation (Ai) in the presence of tempol (20 mm). Regions not investigated by paramagnetic probing are indicated in gray.

