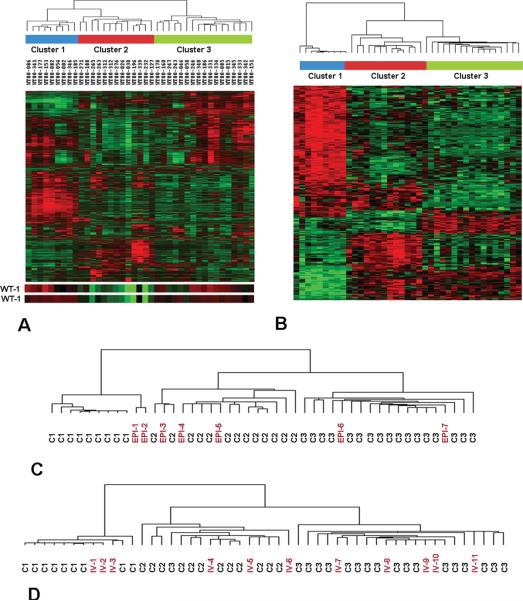
Figure 1. Unsupervised Hierarchical Clustering of 39 VLRWT.
A. The 4000 probesets with the highest coefficient of variation were utilized for unsupervised analysis using hierarchical clustering. Three primary clusters can be discriminated, as shown. Expression of genes, clustered on the Y-axis, is shown with levels ranging from high (red) to low (green). The expression of the two WT1 probesets are located at the bottom, illustrating decreased WT1 expression in Cluster 2 tumors.
B. Heirarchical analysis of the top 239 genes with fold change >2.5 and p value <0.00001, showing distinctive grouping of genes within the clusters (genes are identified within Supplemental Table 1 in the order of their appearance on this heat map).
C. Heirarchical analysis was performed using the 239 genes in Supplemental Table 1 to analyze the above 39 tumors plus 7 epithelial differentiated tumors identified from older patients. The dendogram demonstrates that these tumors do not cluster with C1 tumors.
D. Hierarchical clustering was performed using the 239 genes in Supplemental Table 1 to analyze the above 39 tumors plus an independent validation set of 11 tumors. The dendogram reveals tight clustering of the validation set within these clusters, with preserved clinical and pathologic associations within these clusters (Table 1).

