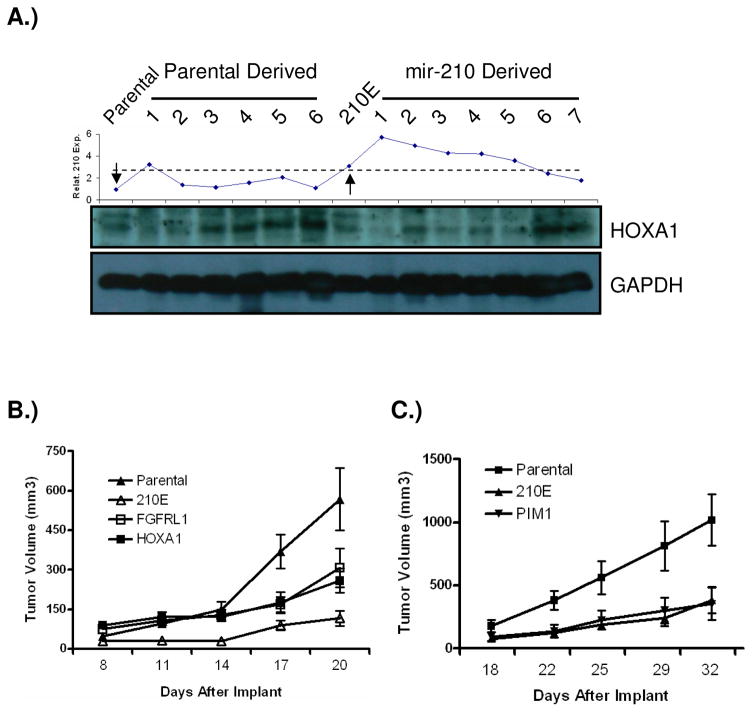
Figure 7.
HOXA1 is regulated by mir-210 in vivo. A) HOXA1 protein in harvested tumor xenograft samples. Top panel, mir-210 expression in each sample; bottom panel, HOXA1 protein level in corresponding samples. The left and right arrows in the top panel indicate the input parental and input mir-210 expressing cells, respectively. Dotted line indicates two groups of samples with inversed profiles of mir-210 expression and HOXA1 protein level. B) The inhibitory effect of mir-210 on tumor growth initiation was partially rescued by expressing HOXA1 or FGFRL1 coding sequence without a 3′ UTR region. Each group of FaDu cells was injected s.c in nude mice at a density of 2.5x10⁶ cells. N=7 for the each group. C) Expressing PIM1 coding sequence without a 3′ UTR region has no effect on the inhibitory effect of mir-210 on tumor growth initiation. Each group of FaDu cells was injected s.c in nude mice at a density of 3x10⁶ cells. N=7 for the each group.

