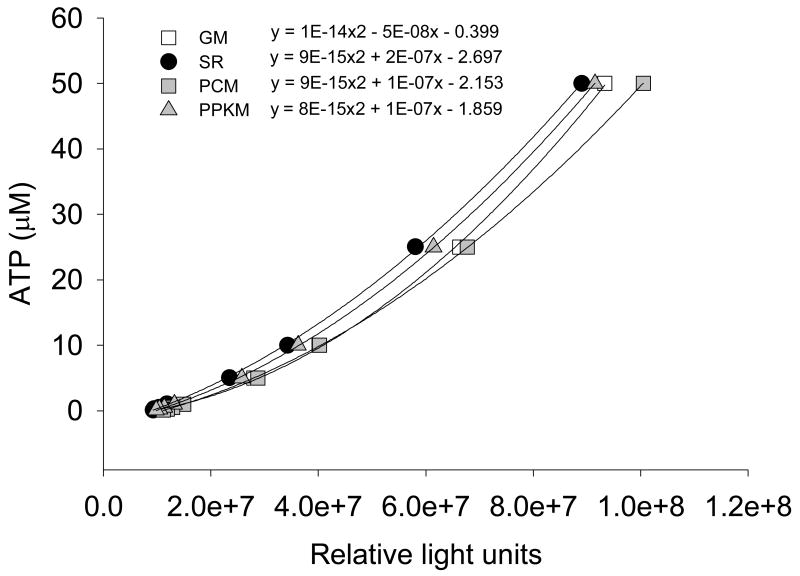
Figure 4. ATP standard curves.
A series of known ATP standards from 0.1 to 50 μM are used to quantify of ATP synthesis rates in isolated mitochondria. Individual standard curves for each substrate combination (GM: mlutamate + malate, SR: succinate + rotenone, PCM: palmitoyl carnitine + malate, PPKM: pyruvate + palmitoyl carnitine + α-ketoglutarate + malate) are generated by measuring light production (relative light units) following the addition of the luciferin-luciferase reagent.

