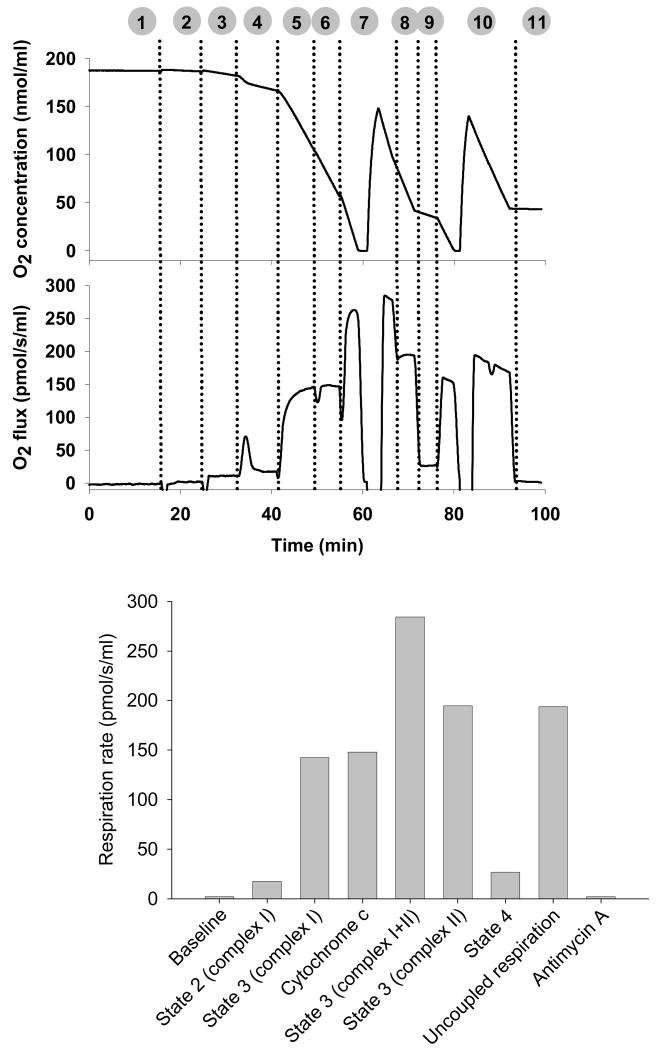
Figure 6. High-resolution respirometry.
Representative plots of oxygen concentration (top panel) and oxygen flux rate (bottom panel) during a stepwise protocol designed for functional assessment of isolated mitochondria. 1) gas phase equilibration, 2) baseline mitochondrial respiration, 3) substrates glutamate and malate (state 2, complex I), 4) submaximal ADP pulse for assessment of P:O, 5) saturating ADP (state 3, complex I), 6) cytochrome c (membrane integrity), 7) succinate (state 3 complex I + II), 8) rotenone (state 3 complex II), 9) oligomycin (state 4), 10) FCCP (uncoupled respiration), 11) antimycin A (background). Average rates of oxygen consumption for each condition are shown in the bottom panel.

