

Abstract
65Cu central-transition NMR spectroscopy of the blue copper protein azurin in the reduced Cu(I) state, conducted at 18.8 Tesla and 10 K, gave a strongly second order quadrupole perturbed spectrum, which yielded a 65Cu quadrupole coupling constant of ±71.2 ± 1 MHz, corresponding to an electric field gradient of ±1.49 atomic units at the copper site, and an asymmetry parameter of approximately 0.2. Quantum chemical calculations employing second order Møller-Plesset perturbation theory and large basis sets successfully reproduced these experimental results. Sensitivity and relaxation times were quite favorable, suggesting that NMR may be a useful probe of the electronic state of copper sites in proteins.
Keywords: 65Cu NMR, azurin, blue copper protein, nuclear quadrupole coupling
Copper is a ubiquitous component of living systems. It fulfills a vital role in many enzymes, particularly redox enzymes. As might be anticipated from the chemistry of the element, the primary redox couple involved in biological redox processes is Cu+/Cu2+. However, multinuclear copper centers1,2 and mixed metal centers3 give it the ability to participate in multielectron processes. Among its most important redox roles are in cytochrome c oxidase, which was proved to be a copper enzyme by nutritional, enzymological and spectroscopic studies4, and which contains three coppers per molecule5, two in a dinuclear center. Cytochrome c oxidase acts as the terminal enzyme in the respiratory chain, reducing molecular oxygen in a four-electron process to water. Other copper-containing redox enzymes are tyrosinase6 and various other oxidases7. The copper, zinc superoxide dismutase of mammalian erythrocytes performs the rather different role of eliminating superoxide in an alternating sequence of single-electron oxidation and reduction steps8. Some organisms use copper hemocyanins, which contain a binuclear copper site9, as oxygen transporters. In addition to these metabolic functions, organisms use copper chaperones10 to transport the toxic metal. In terms of generalities, it has been noted11 that copper is usually associated with the metabolism of O2 or oxides of nitrogen, and copper proteins often also contain organic radicals.
Copper sites in proteins have been classified into several types: type-112, type-213, and type-31 copper, as well as the dinuclear CuA center14. Among the best-studied are the type-1 sites, characterized by a strong absorption in the orange region of the visible spectrum. The blue copper proteins, a class of relatively small, one-electron transfer proteins found in bacteria and plants, notably employ type-1 copper sites.
The classical type-1 copper site has three primary ligands: two histidines and a cysteine, arrayed in a more-or-less distorted trigonal geometry. A fourth ligand, which is often methionine, but is glutamine in stellacyanin15, and leucine in laccase1 and some of the ceruloplasmin copper sites16, is more weakly coordinated to the copper; a proposed fifth ligand in azurin, the main-chain carbonyl of Gly-4517, shows no substantial covalent interaction in electronic structure calculations18, but may alter the redox potential by electrostatic effects. The reduction potential of type-1 sites extends from 184 mV in stellacyanin19 — very similar to that of free Cu2+ in aqueous solutwion (150 mV) — upwards to around 670 mV for rusticyanin20. The role of the protein in ‘tuning’ this potential is a matter of considerable interest; particularly since blue copper sites with redox potentials on the extreme part of the range, such as rusticyanin, have largely unremarkable ligand geometries21.
The Cu2+ state of blue copper proteins has been extensively studied by crystallography, NMR, X-ray spectroscopy, and EPR/ENDOR; much of the experimental backing for quantum calculations in fact comes from measured hyperfine tensors. In contrast, the Cu+ state is largely ‘spectroscopically silent’; it is colorless, and being diamagnetic, EPR and related techniques are inapplicable.
The most precise measurements of the inner sphere probably come from X-ray absorption fine structure (EXAFS). Early measurements on P. aeruginosa azurin22 indicated rCuN = 195 ± 3 pm, rCuS = 223 ± 3 pm for the oxidized Cu(II) form; and distinctly different rCuN values of 189 and 205 pm for the reduced form. Another study on reduced azurin23 gave anomalous results for the first coordination sphere, with ‘1 – 1.5’ nitrogens or oxygens and ‘1.5 – 2’ sulfurs or chlorines. More recent data analyzed by more sophisticated methods gave rCuN = 195, rCuS = 214 pm for oxidized azurin24. The structurally similar but more easily reduced blue copper protein rusticyanin gave25 rCuN = (186 pm, 205 pm), rCuS = 215 pm, while two distinct stellacyanins16 gave rCuN = 195 – 196 pm, rCuS = 217 – 218 pm. Finally, the similar but not identical A. xylosoxidans azurin II yielded EXAFS distances26 of rCuN = (186 pm, 194 pm), rCuS = 216 pm in the oxidized form and (191 pm, 201 pm), rCuS = 219 pm in the reduced form. The consensus of these results is that the first coordination sphere distances for blue copper proteins all fall within a narrow range and are not substantially correlated with reduction potentials, and that reduction has minor effects, probably making the histidines slightly less equivalent in terms of their proximity to the copper and slightly lengthening all the copper-ligand distances. However, the preponderance of the evidence is that the reduction of the copper charge by one unit does not affect the ligands in any major way. The more distant methionine ligand is close enough in rusticyanin (260 pm) to have discernible effects on the copper X-ray absorption fine structure, but at over 300 pm, does not discernibly affect in stellacyanin or azurin.
The early 2.7 Å structure of azurin17 has ligand copper distances that are implausible and conflict with EXAFS data. The later unpublished but deposited structures of reduced P. aeruginosa azurin27 at pH 5.5 and 9.0 have distances rCuN = (205 pm, 219 pm), rCuS = 228 pm and rCuN = (232 pm, 239 pm), rCuS = 263 pm, respectively, much longer than the EXAFS data indicate. A more recent structure28 of reduced azurin II, at a much higher resolution of 1.13 Å gives much more compatible distances rCuN = (201 pm, 202 pm), rCuS = 221 pm; these are, nonetheless, still significantly longer than the EXAFS results, and, given the difficulty of accurately fitting EXAFS data with two identical ligands with closely similar distances, still leave the precise ligand geometry in some doubt. A QM/MM study published in the same paper, carried out at a relatively low basis set level with a hybrid functional, gave comparatively poor values of ligand-copper distances for the reduced form of azurin II, but better values for the oxidized form. The study also did a poor job in reproducing reduction potentials.
Quantum chemical calculations by the group of Solomon29 and others30 suggest that type-1 copper sites have low-symmetry ligand fields, with distinct energies for the five d orbitals. The highest occupied molecular orbital is actually an anti-bonding π orbital formed by mixing the Cu dx2 – y2 with a sulfur pz orbital. This has the effect of reducing the copper hyperfine splitting of the EPR spectrum to about half its normal value31. An early ENDOR result32 gave a value of 8 MHz for the copper electric quadrupolar coupling constant CQ = eQVzz/h for the Cu(II) form. CQ is a result of the interaction of the quadrupole moment of the nucleus eQ with the local electric field gradient (EFG) tensor, and is therefore a sensitive probe of the electron density, particularly that close to the nucleus.
At natural abundance, copper has two spin 3/2 isotopes, 63Cu (69.2%) and 65Cu (30.8%). They have relatively high gyromagnetic ratios (γ), but large quadrupole moments33. Notwithstanding the relatively small CQ of the paramagnetic form, these large moments lead one to expect a large CQ for reduced azurin, which makes high-field NMR problematic, even when the first-order contribution of CQ to the spectrum is eliminated by observing the central +½ → ½ transition. However, although it sets substantial experimental challenges, the nuclear quadrupole interaction is an exquisitely sensitive measure of the electron density around the nuclear site, and in tandem with quantum chemical calculations, constitutes a stringent test of our understanding of the electronic structure and environment. The bulk of the nuclear magnetic resonance experiments performed on Cu(I) to date has been at zero field, by nuclear quadrupole resonance (NQR) ; mostly on Cu+ complexes, except for the reduced form of the enzyme superoxide dismutase.34 However, with the advent of high magnetic fields, NMR of Cu+ complexes has become feasible35; and the recent successful observation of other quadrupolar, diamagnetic metals sites such as 25Mg and 67Zn in proteins36, made the prospect of observing the more receptive but also more spectrally dispersed 63Cu/65Cu nuclei a possibility. We have therefore set out to characterize the 65Cu NMR spectrum and ancillary properties of azurin, as a canonical blue copper protein, and investigate methods to compute, ab initio, accurate electric field gradients at the copper site in systems of this sort.
EXPERIMENTAL
As a representative blue copper protein, we chose azurin from Pseudomonas aeruginosa, which has been cloned, can be periplasmically expressed at high levels, is easily isolated from E. coli, can be reduced under comparatively mild conditions, and has been exhaustively characterized17, 18, 22, 23, 24, 26, 27, 28. We selected for our observation the less-abundant 65Cu nucleus, because it has a higher γ, slightly smaller quadrupole moment, and a resonance frequency that prevents accidental overlap with potential 23Na resonances. High magnetic fields (18.8 T) are critical to maximize the sensitivity and reduce the second-order linewidth of the central transition as much as possible. Likewise, we employed cross-polarization (CP) methods37, to achieve selective observation of protein-bound copper in the presence of large background signals from the potential copper alloys that are ubiquitous in electronic components.
A synthetic gene coding for P. aeruginosa azurin, including the 18 amino acid natural leader peptide for periplasmic expression, was cloned into Genscript’s pET expression plasmid to give plasmid pGS-azurin. This plasmid was then transformed into E. coli BL21 (DE3) competent cells. E. coli transformants containing pGS-azurin were initially grown on LB/Agar plates, and the colonies used to inoculate small scale growths which were subsequently injected into a 2 liter New Brunswick Scientific Bio Flow 110 Fermenter for large scale fermentation. The fermenter was set up to maintain a temperature at 35°C, pH 7, and dissolved O2 at 30%. Induction with Isopropyl-β-D-thiogalactopyranoside (IPTG) was performed at 6 hours, when the culture was measured at an optical density of approximately 20; the temperature was lowered to 25°C to increase protein production. The culture remained at this state for 17 hours, at which point they were harvested for immediate protein isolation and purification38, which broadly followed the procedure of Karllson et al.39. After the periplasmic protein was released by osmotic shock and 0.5 M ammonium acetate added at pH 4.1 to precipitate contaminating acidic proteins, highly (97%) enriched 65Cu in the form of CuCl2 was then added to the azurin solution resulting in a large enhancement of the bright blue color — because the copper content of the growth medium is relatively low, most of the expressed protein is actually apo-azurin, facilitating isotope enrichment. The sample was further purified by cation exchange liquid chromatography through a 10 × 1.6 cm column with Poros 20 CM weak cation exchange resin. The purified sample was then concentrated, dialyzed against pure water, and freeze-dried. The procedure resulted in protein that was homogeneous by polyacrylamide gel electrophoresis in a sodium dodecyl sulfate denaturing buffer. Approximately 2 g of azurin was obtained per liter of fermentor culture.
For NMR samples, 70 mg of azurin were mixed with 20 mg of cobalt carbonic anhydrase as a paramagnetic dopant40, 36 in 150 μL of 50 mM ascorbate and 30% glycerol. The ascorbate solution had been previously sparged with N2 gas for 20 minutes to eliminate any dissolved O2. The final sample of ~0.2 mL faded from a dark blue to a clear light purple solution, which was pipetted into a 5 × 20 mm NMR tube. All NMR experiments were carried out in the Environmental Molecular Sciences Laboratory (EMSL) at Pacific Northwest National Laboratory (PNNL), at a proton frequency of 800 MHz, using a zinc metal cross-coil, where the inner Helmholtz coil was tuned to 1H and the outer solenoid was tuned to 65Cu. To enhance the Boltzmann polarization, the NMR data were obtained at a temperature of 10 K, except where otherwise stated; most of the details associated with the data acquisition are summarized elsewhere41. The proton π/2 pulse width used for cross polarization (CP) was 7 μs with a 30 ms contact time and 30 s recycle delay. The 65Cu π pulses used in the quadrupole Carr-Purcell-Meiboom-Gill (QCPMG) pulse train were 19 μs with a τ of 150μs and a decoupling field of 44 kHz for 512 transients.
Most computations on the simpler models used the program GAMESS42, but non-relativistic calculations on diatomic CuCl used Gaussian-0343. Quantum mechanics/molecular mechanics (QM/MM) geometry optimizations and calculations of the electric field gradient (EFG) tensors were performed using the QM/MM module44 of the NWChem computational chemistry package developed at PNNL45, 46. An X-ray geometry of reduced Azurin (1JZG)47 from the Research Collaboratory for Structural Biophysics served as a starting point for geometry optimizations. For the quantum atoms density functional theory (DFT) was used with the exchange-correlation functional defined as the local spin density approximation (LSDA or LDA) utilizing Slater’s local spin density exchange48 and the Vosko, Wilk, and Nusair (VWN) local spin density correlation functional49, with an Ahlrichs double-ζ basis set with polarization (pAVDZ)50. The LDA functional was chosen for the optimization as it has been shown to give a more reliable geometry for zinc metalloproteins,51,52 however, changes to the copper ligand distances were also explored with optimizations utilizing HF or the NWChem implementation of the Becke three-parameter Lee-Yang-Parr functional53 (B3LYP) as well. The GAMESS and G03 calculations were performed on an Apple Xserve cluster at UNL. NWChem calculations were carried out on a Beowulf cluster at PNNL composed of 56 node Verari Bladerack (40- dual-socket, dual-core Intel 5140 2.33 GHz Xeon and 16- dual quad Intel 5345 2.33 GHz Xeon) or Chinook, the 2310 node Hewlett-Packard system (two quad-core, 2.2 GHz AMD Barcelona processors) present in the EMSL.
RESULTS
In Figure 1 we summarize the result of several frequency shifted spikelet experiments obtained on a sample of azurin. In acquiring the data we assumed the spectrum would be broad and that we would be unable to acquire the full spectrum continuously. We therefore surveyed the spectrum utilizing large offsets (100 kHz) with a finer step size to define key points within the lineshape36, 41. The extra intensity in the center of the spectrum (near 0 kHz) appears to arise from a copper(I) containing impurity (<2%) in the sample which is enhanced by the CP more than the protein as it is not visible by direct polarization methods (data not shown). The data can be fit to a 65Cu CQ of ± 71.2 ± 1 MHz and an asymmetry parameter, ηQ, of 0.2 ± 0.1. With a ratio of 63Cu to 65Cu quadrupole moments54 of 1.08041 ± 0.00009 and a 63Cu Q33 of −22.0 ± 1.5 fm2, we obtain for the most distinct principal value of the EFG, Vzz = ± 1.49 ± 0.10 atomic units (a.u.) for Cu(I) azurin.
Figure 1.

The skyline projection of the various frequency offsets of the 65Cu NMR spectra of azurin at 18.8 T and 10 K, with a simulated lineshape calculated from the parameters listed in the text. Each individual experiment required 4.2 hrs for a total time of approximately 3.5 weeks.
Spikelet experiments were also carried out using a π/2 pulse on the copper, rather than cross-polarization for excitation, and the 65Cu longitudinal spin relaxation of the central transition probed by progressive saturation. The data shown in Fig. 2 were collected at a frequency offset of +1.2 MHz from the nominal 65Cu Zeeman frequency. As expected, the relaxation is biexponential55, and the recovery from saturation of the central transition will occur with two equally weighted components56, corresponding to the central and satellite transition relaxation.
Figure 2.

(a) (Points) integrated echo signal intensity for 65Cu-azurin, as a function of relaxation delay, in a QCPMG spikelet experiment at 8 K. (Line) fit to a biexponential recovery (b) relaxation times from fits similar to those in 2(a), as a function of sample temperature.
A biexponential fit to two equally weighted functions is shown for the 8 K data in Fig. 2. Unexpectedly, relaxation was efficient even at 8 K, with relaxation times of 2 and 21 s. As expected, both T1s decrease with increased temperature, the slow T1 much more so.
The CPMG echo trains shown in Fig. 3 were obtained at a frequency offset of 1.2 MHz from the nominal 65Cu Zeeman frequency by direct excitation of the resonance, followed by an echo train either combined with, or without, 1H dipolar decoupling during the delays. As can be seen, even the first echo is nearly completely attenuated in the absence of dipolar decoupling, showing the presence of nearby protons, thus confirming that the signal is in fact from a metal site in the protein, and not from metallic copper in the probe, inorganic copper, or Cu+ ions in solution, which would have much longer average Cu-H distances.
Figure 3.

Spikelet echo train, observed at 1 MHz above the 65Cu Zeeman frequency, (a) with and (b) without proton decoupling during the intervals between 180° pulses.
THEORETICAL
Basis set convergence and electron correlation in Cu(I) compounds
Although some attempts34, 57, 58 have been made to compare experimental and computed copper electric field gradients, these studies have generally been conducted with rather small basis sets and with either Hartree-Fock or density functional theory using standard functionals; the latter have already been shown to be problematic59 for copper EFGs. Since copper CQ values have not been benchmarked nearly as extensively, for example, as first row main group elements, we undertook a comparison of basis sets and methods for a diatomic, CuCl, whose structure and quadrupole constants have been carefully examined by microwave spectroscopy36, 60. While CuCl might seem to be a curious choice to begin a computational study of blue copper proteins, it is in terms of its electronic structure surprisingly similar; the formally singly negatively charged sulfur which is the strongest ligand to copper in azurin is isoelectronic to chlorine, and the highest occupied molecular orbitals are virtually identical.
Calculations on CuCl were done using the program Gaussian-03, for a series of basis sets of increasing size, and at several levels of correlation. The reported ground state rotational constant B0 gave, using standard values of atomic masses and constants, a r0 value of 205.411 pm; this is in effect the inverse square root of the expectation value of r−2 over the vibrational ground state wavefunction. With our computing facilities, we were able to compute Hartree-Fock (HF) and Møller-Plesset second order (MP2) quadrupole constants, at the bond distance r0 = 205.4 pm, up to the non-relativistic valence quintuple zeta level, using the aug-cc-pVnZ-NR basis sets for copper61 and standard aug-cc-pVnZ bases for chlorine62. We could get full coupled-cluster single-double (CCSD) EFGs only up to the VTZ level; however, we were able to compute VQZ-level quadrupole constants for the molecule if the h orbitals were removed. The results of these computations are compiled in Table 1, and should be compared with experimental values of the EFG obtained by using established values of the 63Cu and 63Cl moments33, 63 — Q = 22.0 ± 1.5 fm2 and −8.165 ± 0.080 fm2 respectively — to convert the measured 63Cu63Cl CQ,0 values of 14.9635 ± 0.0027 MHz (63Cu) and −32.1247 ± 0.0020 MHz (63Cl) to Vzz,0, giving values of 0.313 ± 0.020 a.u. and −1.674 ± 0.017 a.u. at the copper and chlorine sites respectively. The uncertainty in the experimental values overwhelmingly lies in the value of the quadrupole moment.
Table 1.
computed electric field gradients Vzz, in atomic units, at the nuclear site for copper and chlorine in diatomic CuCl. The CCSD results for aug-cc-pVQZ were computed without h basis functions. Experimental EFGs are 0.313 ± 0.020 a.u. and −1.674 ± 0.017 a.u for copper and chlorine respectively.
| HF | MP2 | CCSD | ||||
|---|---|---|---|---|---|---|
| Cu | Cl | Cu | Cl | Cu | Cl | |
| aug-cc-pVTZ(-NR) | 0.7575 | −0.9633 | 0.3557 | −1.462 | 0.4094 | −1.3333 |
| aug-cc-pVTZ-DK | 0.7911 | −1.0992 | 0.3241 | −1.6523 | ||
| aug-cc-pVQZ(-NR) | 0.7833 | −0.9196 | 0.4047 | −1.419 | 0.4555 | −1.2783 |
| aug-cc-pV5Z(-NR) | 0.806 | −0.9872 | 0.4297 | −1.5182 | ||
Quantum computations of course give only re; a variational solution to the 1D Schrödinger equation using potential energies computed as a function of r at the aug-cc-pVTZ(-NR) level with CCSD(T) energies, allowed estimates of the corrections for zero-point vibration to be calculated. Because of the large reduced mass (μ = 22.48 a.m.u.) and the relatively flat Vzz(r) curves, the corrections are small (−0.002 a.u. for copper, −0.003 a.u. for chlorine); these are much smaller than experimental uncertainties and were therefore ignored.
The electron correlation energy computed at the CCSD level is similar for the aug-cc-pVTZ and the truncated aug-cc-pVQZ bases, and so it seems to be largely basis set independent at this level of theory; we can therefore get an estimate of the CCSD/aug-cc-pV5Z Vzz,e by applying the aug-cc-pVTZ electron correlation contribution to the HF/aug-cc-pV5Z Vzz,e values, giving us computed values of Vzz,0 of 0.456 and −1.360 a.u. at the copper and chlorine sites. These values are obviously not close to experiment at the level of accuracy one would expect for, say, first row main block elements. In order to try to identify the cause of this discrepancy, relativistic calculations were undertaken, using the aug-cc-pVTZ-DK basis set of Balabanov and Petersen61 for the copper, and the cc-pVTZ-DK set of de Jong et al.64 on the chlorine, augmented with a set of diffuse functions from the non-relativistic set; and a second-order Douglas-Kroll correction65 to the one-electron integrals. The computed EFGs were substantially increased for the chlorine and reduced slightly for the MP2 calculation, although not for the HF; the overall agreement for the MP2/aug-cc-pVTZ-DK basis set is however excellent, although the poorer agreement at the quadruple and quintuple zeta levels may indicate this is partly a result of cancellation of errors; it is likely incomplete accounting for electron correlation partially negates the effect of incomplete basis sets.
One final note; in order to evaluate the efficacy of density functional theory (DFT) in this system, we computed Vzz at the aug-cc-pVTZ(-NR) level for three different functionals: simple local spin-density approximation (LSDA); and the PBE/PBE and B3LYP hybrid functionals. The results are given in Table 2, and as can be seen, the functionals, while being reasonably consistent with each other, perform very poorly in EFG computations; all three get the sign of Vzz at copper wrong!
Table 2.
computed electric field gradients, in atomic units at the nuclear site for copper and chlorine and chlorine in diatomic CuCl, at the aug-cc-pVTZ level, using three different density functionals.
| Cu | Cl | |
|---|---|---|
| LSDA | −0.5778 | −2.0692 |
| PBEPBE | −0.5413 | −1.9687 |
| B3LYP | −0.2439 | −1.7841 |
These results are in excellent agreement with those of Schwerdtfeder and co-workers59, 66 who have shown in a series of papers that standard functionals give very poor results when applied to the EFGs of d-block elements, and need to be adjusted to account for the different correlation properties of the d orbitals. Schwerdtfeder and co-workers59 used a single basis set very similar in size to aug-cc-pVTZ, and did not examine basis set convergence. Their MP2 and CCSD results are very similar to ours.
For this reason, we have not used DFT in the present work to compute field gradients, but merely in some cases to optimize structures. We mention these computations to sound a cautionary note that MP2 calculations may be more suited to EFG calculations for copper. This is just the opposite of what we observed for zinc EFG calculations51, 52.
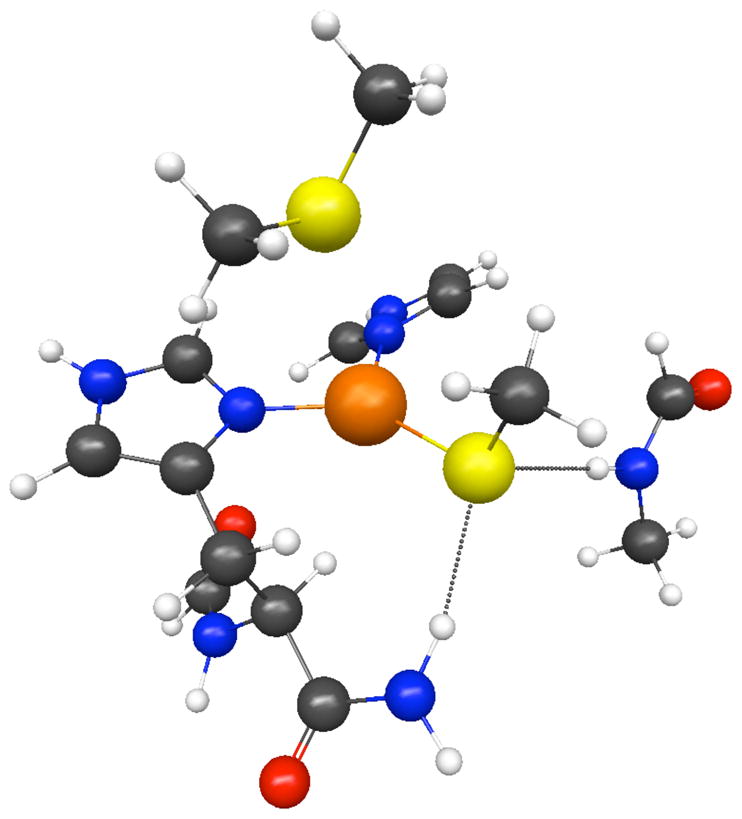
Bis(imidazole) copper(I)methylsulfide
The compound bis(imidazole)copper(I)methylsulfide was chosen as a simple but chemically reasonable theoretical model for the blue copper protein binding site. The structure of the complex was optimized using Møller-Plesset second order perturbation theory (MP2) with the symmetry constrained to Cs and the Cu, S and methyl C lying on the mirror plane. The basis sets used for the structure optimization were aug-cc-pVTZ-NR for Cu and aug-cc-pVDZ for the rest of the complex. The optimized structure is shown in Fig. 4 (coordinates are deposited as supplementary material in Table 5) The copper coordination is almost perfectly planar, with ∠SCuN = 106.18° and ∠NCuN = 147.26° the sum of the three angles around the copper is 359.62°. The ligand copper distances are rCuS = 230.1 pm; rCuN = 190.6 pm. The imidazoles are essentially coplanar with the copper trigonal plane; the electronic structure is similar to that computed by us (see below) and by others for the blue-copper protein site. In particular, the highest occupied molecular orbital (HOMO) is, as expected, composed predominantly of the sulfur pz orbital, with a small degree of antibonding interaction with the copper dxy. The copper ligand distances are fairly close to those measured by EXAFS for reduced A. xyloxidans azurin II28, which is probably the most similar reduced azurin structure for which such data are available; in particular, the Cu-N distances are exactly equal to the average of the azurin-II distances, while the optimized CuS distance is 10 pm longer.
Figure 4.

Optimized structure of bis imidazole Cu(I) methylsulfide, one of the azurin models used for quantum chemical calculations.
The method used for estimating electron correlation made a profound difference to the computed equilibrium structure. A HF optimized structure at the same basis level achieved similar topology but had very different Cu-N bond distances: rCuS = 234.2 pm; rCuN = 222.0 pm. The B3LYP density functional shortened the Cu-S bond somewhat but retained a long Cu-N bond (rCuS = 228.3 pm; rCuN = 205.5 pm).
Using this MP2-optimized structure as a base, we computed EFG tensors. By symmetry, two of the tensor principal axes must lie in the mirror plane with the third orthogonal to it. In fact, in all of the MP2 calculations the intermediate of the three principal values corresponds to the axis orthogonal to the mirror plane, with the most distinct principal axis within the mirror plane and approximately along the molecular trigonal axis, and the third principal axis 2.9° from the Cu-S bond. The computed Vzz is − 1.806 a.u., about 20% larger than the experimental value for azurin; the computed η of 0.170 is well within experimental error.
We also computed the quadrupolar parameters as a function of level of theory, and of the ligand copper distance. Table 3 shows the computed HF and MP2 gradients for three basis set levels. As well as the ‘standard’ basis set used for optimization (set I), we computed field gradients with the copper and the directly bonded ligand atoms at the aug-cc-pVTZ level, more distant atoms being at aug-cc-pVDZ (set II) and with the copper at aug-cc-pVQZ-NR, directly bonded atoms at aug-cc-pVTZ, and more distant atoms at aug-cc-pVDZ (set III). The MP2 calculations are very similar, and make a strong case that basis set convergence is not a major issue for EFG calculations in this system. The differences between HF and MP2 calculations indicate that electron correlation is a moderate but not dominant contribution in this system. One feature that is not evident in the table is that at the two higher basis set levels, the x and y axes (corresponding to the two smaller principal values in absolute magnitude, lying within the molecular trigonal plane) are switched between MP2 and HF, and so the EFG tensors are more different than they appear.
Table 3.
Computed field gradients and asymmetry parameters for bisimidazole Cu(I) methylsulfide, at three different basis levels described in the text, using either non-relativistic or Douglas-Kroll single electron Hamiltonians.
| Non-relativistic Hamiltonian | Douglas-Kroll Hamiltonian | |||||||
|---|---|---|---|---|---|---|---|---|
| HF | MP2 | HF | MP2 | |||||
| Vzz, a.u. | η | Vzz, a.u. | η | Vzz, a.u. | η | Vzz, a.u. | η | |
| Basis set I | −1.864 | 0.276 | −1.717 | 0.174 | − 1.997 | 0.250 | −1.843 | 0.201 |
| Basis set II | −1.865 | 0.269 | −1.698 | 0.185 | − 1.997 | 0.242 | −1.822 | 0.213 |
| Basis set III | −2.014 | 0.296 | −1.860 | 0.135 | ||||
We also examined the effect of second-order relativistic Douglas-Kroll corrections of the EFGs, using the aug-cc-pVTZ-DK basis set of Balabanov and Petersen61 on the copper, and the cc-pVTZ-DK set of de Jong et al.64 on the sulfur, augmented with diffuse functions from the non-relativistic set. All other atoms were treated non-relativistically. In contrast to CuCl, the effects of the DK correction were to monotonically increase the EFG at the copper by around 7 – 8%.
More interesting is the effect of bond distance on Vzz and η, presented in Fig. 2. It can be seen that as either the Cu-N or the Cu-S distance shortens, the magnitude of Vzz increases. This is a straightforward reflection of the symmetry of the system. Since all the ligand copper interactions are within the trigonal plane, strengthening these interactions will increase the difference between the in-plane and out of plane elements of the field gradient, and the out of plane element corresponds to the z direction of the field gradient tensor. In contrast, η reflects asymmetry within the trigonal plane, and so changes in the Cu-N and the Cu-S distance have opposite effects.
Azurin active site models
We have also examined several models closer in chemistry to the azurin active site. Model 2 used the coordinates for reduced azurin from the RCSB database19, truncated to Gly45, His-46 (and the amide of Asn-47; residues 112–114 (Cys-Thr-Phe), His-117, and Met-121. Proton positions were optimized at the B3LYP/6–31**G(d) level. Model 3 was a modified model with the ligands pulled in to the EXAFS distances and the linking amino acids optimized. The optimized EXAFS structure is shown as Fig. 6. Following the optimization, electric field gradients were computed with the copper, imidazole and cysteine ligands at the aug-cc-pVTZ level and the rest of the complex at the 3–21G level, using both HF and MP2 methods.
Figure 6.
Optimized azurin active site model 3, used to compute electric field gradient tensors.
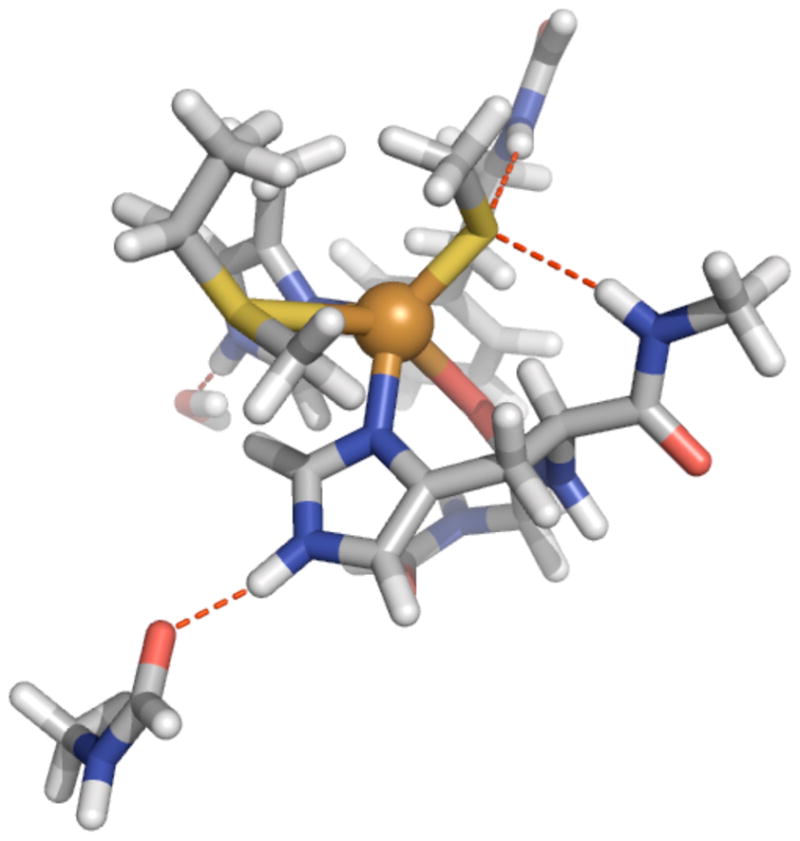
Model 4, for QM/MM calculations, was constructed as follows: starting with the x-ray structure (1JZG), the following deletions were made; (2,2′:6′,2′-tetrapyridine)-(1,10-phenanthroline) ruthenium (II) and tetra(imidazole) diaqua cooper(I). Along with the metal ion we include as quantum the direct ligands; histidine 46 (as HIE), histidine 117 (HIE), cysteine 112 (CYM), methionine 121, and the carbonyl of glycine 45. The hydrogen bonding partners to these residues are also included in the model. There is a water hydrogen bonded to the NHε of His117, the carbonyl of Asn10 for the NHε of His46, the backbone NH’s of Asn47 and Phe114 are each hydrogen bonded to the coordinating sulfur of Cys112, and the aromatic ring of Phe114 is also included for its potential to interact with the lone pair of the Glu45’s coordinating CO. This model of the metal site, prior to optimization is shown in Fig. 7. Geometry optimizations were performed with the LDA functional utilizing pAVDZ basis sets for all quantum atoms followed by electric field gradient calculations utilizing aug-cc-VTZ-NR basis sets for both Cu and S and Ahlrichs triple-ζ basis set with polarization (pAVTZ)67 for the remaining atoms. The structure obtained (coordinates of the quantum region are included as Table 6 of the supplemental material) gives ligand distances very close to EXAFS values rCuN = (198 pm, 198 pm), rCuS = 222 pm,, rCuS(Met) = 287 pm.
Figure 7.
Quantum region used for the QM/MM calculations.
The computed EFGs are summarized in Table 4. As can be seen, model 3, with EXAFS copper-ligand distances gives Vzz values in much better agreement with experiment than model 2, but a high value of η; the agreement with the HF computations is slightly worse that those with MP2. Model 4, obtained with full QM/MM, performs even better, with the CQ and η both well within experimental error of the measured tensor.
Table 4.
Computed field gradients and asymmetry parameters for an azurin active site model, using X-ray and EXAFS ligand geometries, at the basis set level described in the text.
| HF | MP2 | |||
|---|---|---|---|---|
| Vzz (a.u.) | η | Vzz (a.u.) | η | |
| Model 2 (X-ray) | −0.674 | 0.534 | −0.676 | 0.534 |
| Model 3 (EXAFS) | −1.727 | 0.325 | −1.643 | 0.297 |
| Model 4 (QM-MM) | −1.484 | 0.276 | −1.516 | 0.153 |
DISCUSSION
This is the first measurement of a copper NMR signal of a protein at high field; previous measurements were by NQR at zero field. The measured value for CQ is large but not unusually so; tris[dimethylthiourea]copper(I)chloride, for example, with a distorted tetrahedral coordination of three sulfurs and a chloride, has a 63Cu quadrupole coupling68 of ±77.6 MHz and η = 0 by symmetry (Vzz = 1.50 ± 0.09 a.u.). We have carefully checked to make sure the signal could not arise from another species; spectra taken with an empty sample tube show a weak signal, probably due to distant brass components in the probe, but this signal can only be observed by single-pulse methods; it does not appear on cross-polarization. It is also less extensive than the azurin signal. It is improbable that a copper ion in water could be asymmetrically enough coordinated to have a quadrupole coupling of this magnitude. With a spectral width of nearly 3.5 MHz, it is evident that these data would be difficult to acquire at lower magnetic fields. Moreover, the determination of CQ and η provides a stringent constraint on any model for the structure and bonding at the Cu+ site in azurin.
Give the low temperatures employed, the spin-lattice relaxation times measured are quite short. Biexponential relaxation is expected, because the populations of the ±½ states can be affected by relaxation either with the ±3/2 states, connected by a transition that is perturbed by the first order quadrupole coupling; or with each other, connected only by a second-order-perturbed transition. The short relaxation times make direct excitation of the central transition quite competitive with cross-polarization. Such excitation lacks the selectivity of cross-polarization, but has the advantage of using less radiofrequency power and not requiring paramagnetic doping of the sample to reduce 1H relaxation times. The proximity of protons to the copper is also obvious in Fig. 3, where the spikelet echo train is strongly truncated if dipolar decoupling during the echo delays is eliminated. The rate at which these signals decay is consistent with the copper-proton distance. Attempts to determine an anisotropy for the dipolar coupling by comparing spikelets obtained at different parts of the second order pattern were unsuccessful, but in fact there are at least six protons between 3 and 3.5 Å of the copper, both in the plane and near the z axis, so it is unsurprising that the dipolar interactions are not substantially anisotropic.
Most useful, of course, would be a successful computation of the copper quadrupolar interaction, since this would give a powerful probe of the environment of the otherwise spectroscopically silent diamagnetic Cu+ ion. Our computations, indeed, are moderately successful; the consistent tendency to over-estimate the field gradient is seen even in the diatomic CuCl at a very high level of theory. This overestimate could be a result of imprecision in the measurement of the 63Cu quadrupole moment, but errors of a similar absolute magnitude in the computation of the 63Cl quadrupole constant in CuCl — the 63Cl quadrupole moment is much more accurately known — would suggest the problem lies in the electronic structure. There are two major outstanding issues with EFG computations in the first row transition metals. The first is the omission from standard basis sets of functions that would permit core polarization, which is a major contributor to the field gradient at the nucleus69. The second are relativistic effects. While the Douglas-Kroll corrections we have tested correct the one-electron Hamiltonian for scalar relativistic effects, other relativistic contributions remain unaccounted for and their magnitude is not easy to estimate. That being said, however, the overall size and asymmetries of the EFG tensors we obtain for our more sophisticated models are promising. Of particular note are the opposite effects of changes in the Cu-N and Cu-S distances on the quadrupole coupling and asymmetry parameter. Given the observation that including axial ligands and hydrogen bonding seem to bring the computed EFGs much closer to experiment, there is persuasive evidence that 63Cu/65Cu NMR should be a sensitive probe of the ligand geometry in blue copper proteins.
CONCLUSIONS
The relatively facile measurement of a 65Cu NMR spectrum from the blue copper protein azurin at cryogenic temperatures opens up new vistas for the NMR of metalloenzymes. The high sensitivity and short relaxation times we measured even at 8 K indicate that the technique may be generally applicable to proteins of this size or even larger; the successful computation of electric field gradients using basis sets of moderate size and electron correlation corrections by MP2 methods suggest that electronic structure theory combined with NMR experiments should allow the electrostatic environment of copper nuclei in metalloproteins to be probed in detail and with high precision.
Supplementary Material
Figure 5.

Dependence of (a) Vzz and (b) η, on the displacement of the (red) nitrogen and (blue) sulfur ligands from their equilibrium positions.
Acknowledgments
This project was supported by grants from the National Institute of Health (NIH, Federal Grant EB-2050) and the United States Department of Energy (DOE) Office of Science, through PNNL’s Science Undergraduate Laboratory Internship (SULI) program for ARG. This research was carried out in the Environmental Molecular Sciences Laboratory (a national scientific user facility sponsored by the U.S. Department of Energy’s Office of Biological and Environmental Research) located at Pacific Northwest National Laboratory and operated for DOE by Battelle. Computations were performed in part using the Molecular Science Computing Facility in EMSL. NWChem Version 5.1, as developed and distributed by Pacific Northwest National Laboratory, P. O. Box 999, Richland, Washington 99352 USA, and funded by the U. S. Department of Energy, was used to obtain some of these results. We thank Jesse Sears for extensive modifications of NMR probes to eliminate copper background signals, and GSH thanks EMSL for partial funding of a sabbatical. The Macintosh cluster at the University of Nebraska was provided by the Defense Advanced Research Projects Agency.
Footnotes
Supporting materials contain the complete reference 43 and 45, as well as Tables 5 and 6, which give the optimized coordinates of the model complex bis(imidazole)copper(I)methylsulfide and the quantum region of azurin used in QM/MM calculations.
References
- 1.Piontek K, Antorini M, Choinowski T. J Biol Chem. 2002;277:37663–37669. doi: 10.1074/jbc.M204571200. [DOI] [PubMed] [Google Scholar]
- 2.Lieberman RL, Rosenzweig AC. Nature. 2005;434:177–182. doi: 10.1038/nature03311. [DOI] [PubMed] [Google Scholar]
- 3.Michel H, Behr J, Harrenga A, Kannt A. Ann Rev Biophys Biomol Struct. 1998;27:329–356. doi: 10.1146/annurev.biophys.27.1.329. [DOI] [PubMed] [Google Scholar]
- 4.Beinert H. In: The Biochemistry of Copper. Peisach J, Aisen P, Blumberg WE, editors. Academic Press; New York, NY: 1966. pp. 213–234. [Google Scholar]
- 5.Steffens GCM, Biewald R, Buse G. Eur J Biochem. 1987;164:295–300. doi: 10.1111/j.1432-1033.1987.tb11057.x. [DOI] [PubMed] [Google Scholar]
- 6.Lerch K. ACS Symp Ser. 1995;600:64–80. [Google Scholar]
- 7.Battaini G, Granata A, Monzani E, Gullotti M, Casella L. Adv Inorg Chem. 2006;58:185–233. [Google Scholar]
- 8.Tainer JA, Getzoff ED, Richardson JS, Richardson DC. Nature. 1983;306:284–287. doi: 10.1038/306284a0. [DOI] [PubMed] [Google Scholar]
- 9.Woolery GL, Powers L, Winkler M, Solomon EI, Spiro TG. J Am Chem Soc. 1984;106:86–92. [Google Scholar]
- 10.Wernimont AK, Huffman DL, Lamb AL, OHalloran TV, Rosenzweig AC. Nat Struct Biol. 2000;7:766–771. doi: 10.1038/78999. [DOI] [PubMed] [Google Scholar]
- 11.Kaim W, Rall J. Angew Chem Int Ed English. 1996;35:43–60. [Google Scholar]
- 12.Gray HB, Malmstrom, Williams RJP. J Biol Inorg Chem. 2000;5:551–559. doi: 10.1007/s007750000146. [DOI] [PubMed] [Google Scholar]
- 13.Klinman JP. Chem Rev. 1996;96:2541–2561. doi: 10.1021/cr950047g. [DOI] [PubMed] [Google Scholar]
- 14.Beinert H. Eur J Biochem. 1997;245:521–532. doi: 10.1111/j.1432-1033.1997.t01-1-00521.x. [DOI] [PubMed] [Google Scholar]
- 15.Fields BA, Guss JM, Freeman HC. J Mol Biol. 1991;222:1053–1065. doi: 10.1016/0022-2836(91)90593-u. [DOI] [PubMed] [Google Scholar]
- 16.Zaitseva I, Zaitsev V, Card G, Moshkov K, Bax B, Ralph A, Lindley P. J Biol Inorg Chem. 1996;1:15–23. [Google Scholar]
- 17.Adman ET, Jensen LH. Isr J Chem. 1981;21:8–12. RCSB entry 1azu.pdb. [Google Scholar]
- 18.Lowery MD, Solomon EI. Inorg Chim Acta. 1992;198:233–243. [Google Scholar]
- 19.Reinhammar RB. Biochim Biophys Acta. 1972;275:245–259. doi: 10.1016/0005-2728(72)90045-x. [DOI] [PubMed] [Google Scholar]
- 20.Lappin AG, Lewis CA, Ingledew WJ. Inorg Chem. 1986;24:1446–1450. [Google Scholar]
- 21.Waltera RL, Ealicka SE, Friedman AM, Blake RC, II, Proctor P, Shoham M. J Mol Biol. 1996;263:730–751. doi: 10.1006/jmbi.1996.0612. [DOI] [PubMed] [Google Scholar]
- 22.Groeneveld CM, Feiters MC, Hasnain SS, van Rijn J, Reedijk J, Canters GW. Biochim Biophys Acta. 1986;873:214–227. doi: 10.1016/0167-4838(86)90048-8. [DOI] [PubMed] [Google Scholar]
- 23.DeBeer S, Wittung-Stafshede P, Leckner J, Karlsson G, Winkler JR, Gray HB, Malmstrom BG, Solomon EI, Hedman B, Hodgson KO. Inorg Chim Acta. 2000;297:278–282. [Google Scholar]
- 24.DeBeer S, Randall DW, Nersissian AM, Valentine JS, Hedman B, Hodgson KO, Solomon EI. J Phys Chem B. 2000;104:10814–10819. [Google Scholar]
- 25.Grossmann JG, Ingledew WJ, Harvey I, Strange RW, Hasnain SS. Biochemistry. 1995;34:8406–8414. doi: 10.1021/bi00026a023. [DOI] [PubMed] [Google Scholar]
- 26.Cheung KC, Strange RW, Hasnain SS. Acta Cryst D. 2000;56:697–704. doi: 10.1107/s0907444900003310. [DOI] [PubMed] [Google Scholar]
- 27.RCSB Acccession number 1e5y.pdb
- 28.Paraskevopoulos K, Sundararajan M, Surendran R, Hough MA, Eady RR, Hillier IH, Hasnain SS. Dalton Trans. 2006:3067–3076. doi: 10.1039/b513942b. [DOI] [PubMed] [Google Scholar]
- 29.Randall DW, Gamelin DR, LaCroix LB, Solomon EI. J Biol Inorg Chem. 2000;5:16–19. doi: 10.1007/s007750050003. [DOI] [PubMed] [Google Scholar]
- 30.Ryde U, Olsson MHM, Pierloot K. Theor Comp Chem. 2001;9:1–55. [Google Scholar]
- 31.Malmstrom BG, Vanngard TJ. J Mol Biol. 1960;2:118–131. [Google Scholar]
- 32.Roberts JE, Cline JF, Lum V, Freeman H, Gray HB, Peisach J, Reinhammar B, Hoffmann BM. J Am Chem Soc. 1984;106:5324–5330. [Google Scholar]
- 33.Effenberger B, Kunold B, Oesterle W, Schneider M, Simons LM, Abela R, Wuest J. Z Phys A. 1975;309:77–81. [Google Scholar]
- 34.Liao MY, Subramanian R, Yung R, Harbison GS. Z Naturforsch A. 2000;55a:29–36. [Google Scholar]
- 35.Tang JA, Ellis BD, Warren TH, Hanna JV, MacDonald CLB, Schurko RW. J Am Chem Soc. 2007;129:13049–13065. doi: 10.1021/ja073238x. [DOI] [PubMed] [Google Scholar]
- 36.Ellis PD, Lipton AS. Ann Rep NMR Spectrosc. 2007;60:1–38. [Google Scholar]
- 37.Pines A, Gibby MG, Waugh JS. J Chem Phys. 1973;59:569–590. [Google Scholar]
- 38.Gao AR, Heck RW. J Undergrad Res. 2008;8:68–73. [Google Scholar]
- 39.Karlsson BG, Pascher T, Nordling M, Arvidsson RHA, Lundberg LG. FEBS Lett. 1989;246:211–217. doi: 10.1016/0014-5793(89)80285-6. [DOI] [PubMed] [Google Scholar]
- 40.Lipton AS, Heck RW, Ellis PD. J Am Chem Soc. 2004;126:4735–4739. doi: 10.1021/ja0305609. [DOI] [PubMed] [Google Scholar]
- 41.Lipton AS, Wright TA, Bowman MK, Reger DL, Ellis PD. J Am Chem Soc. 2002;124:5850–5860. doi: 10.1021/ja0127133. [DOI] [PubMed] [Google Scholar]
- 42.Schmidt MW, Baldridge KK, Boatz JA, Elbert ST, Gordon MS, Jensen JJ, Koseki S, Matsunaga N, Nguyen KA, Su S, Windus TL, Dupuis M, Montgomery JA. J Comput Chem. 1993;14:1347–1363. [Google Scholar]
- 43.Frisch MJ, et al. Gaussian, Inc. Wallingford CT: 2004. [Google Scholar]
- 44.Valiev M, Yang J, Adams JA, Taylor SS, Weare JH. J Phys Chem B. 2007;111:13455–13464. doi: 10.1021/jp074853q. [DOI] [PubMed] [Google Scholar]
- 45.Bylaska EJ, et al. NW Chem v5.0 ed. Richland, WA 99352, USA: 2006. [Google Scholar]
- 46.Kendall RA, Aprà E, Bernholdt DE, Bylaska EJ, Dupuis M, Fann GI, Harrison RJ, Ju J, Nichols JA, Nieplocha J, Straatsma TP, Windus TL, Wong AT. Computer Phys Comm. 2000;128:260–283. [Google Scholar]
- 47.Crane BR, Di Bilio AJ, Winkler JR, Gray HB. J Am Chem Soc. 2001;123:11623–11631. doi: 10.1021/ja0115870. [DOI] [PubMed] [Google Scholar]
- 48.Slater JC. The Self-Consistent Field for Molecules and Solids. Vol. 4 McGraw-Hill; New York, NY: 1974. [Google Scholar]
- 49.Vosko SH, Wilk L, Nusair M. Can J Phys. 1980;58:1200–1211. [Google Scholar]
- 50.Schafer A, Horn H, Ahlrichs R. J Chem Phys. 1992;97:2571–2577. [Google Scholar]
- 51.Lipton AS, Heck RW, Staeheli GR, Valiev M, De Jong WA, Ellis PD. J Am Chem Soc. 2008;130:6224–6230. doi: 10.1021/ja711240t. [DOI] [PubMed] [Google Scholar]
- 52.Lipton AS, Heck RW, Hernick M, Fierke CA, Ellis PD. J Am Chem Soc. 2008;130:12671–12679. doi: 10.1021/ja801776c. [DOI] [PMC free article] [PubMed] [Google Scholar]
- 53.Becke AD. J Chem Phys. 1993;98:5648–5652. [Google Scholar]
- 54.Hensel KD, Styger C, Jager W, Merer AJ, Gerry MCL. J Chem Phys. 1993;99:3320–3329. [Google Scholar]
- 55.Hubbard PS. J Chem Phys. 1970;53:985–987. [Google Scholar]
- 56.Petit D, Korb JP. Phys Rev B. 1988;37:5761–5780. doi: 10.1103/physrevb.37.5761. [DOI] [PubMed] [Google Scholar]
- 57.Tang JA, Ellis BD, Warren TH, Hanna JV, Macdonald CLB, Schurko RW. J Am Chem Soc. 2007;129:13049–13065. doi: 10.1021/ja073238x. [DOI] [PubMed] [Google Scholar]
- 58.Aguiar PM, Kroeker S. Phys Chem Chem Phys. 2009;11:834–840. doi: 10.1039/b808266a. [DOI] [PubMed] [Google Scholar]
- 59.Schwerdtfeger P, Pernpointner M, Laerdahl JK. J Chem Phys. 1999;111:3357–3364. [Google Scholar]
- 60.Low RJ, Varberg TD, Connelly JP, Auty AR, Howard BJ, Brown JM. J Mol Spect. 1993;161:499–510. [Google Scholar]
- 61.Balabanov NB, Peterson KA. J Chem Phys. 2005;123:064107. doi: 10.1063/1.1998907. [DOI] [PubMed] [Google Scholar]
- 62.Woon DE, Dunning TH., Jr J Chem Phys. 1993;98:1358–1371. [Google Scholar]
- 63.Sundholm D, Olsen J. J Chem Phys. 1993;98:7152–7158. [Google Scholar]
- 64.de Jong WA, Harrison RJ, Dixon DA. J Chem Phys. 2001;114:48–53. [Google Scholar]
- 65.Jansen G, Hess BA. Phys Rev A. 1989;39:6016–6017. doi: 10.1103/physreva.39.6016. [DOI] [PubMed] [Google Scholar]
- 66.Bast R, Schwerdtfeger P. J Chem Phys. 2003;119:5988–5994. [Google Scholar]
- 67.Schafer A, Huber C, Ahlrichs R. J Chem Phys. 1994;100:5829–5835. [Google Scholar]
- 68.McKown GL, Swiger ED. Proc W Va Acad Sci. 1971;43:137–145. [Google Scholar]
- 69.Sternheimer RM. Phys Rev. 1950;284:244–253. [Google Scholar]
Associated Data
This section collects any data citations, data availability statements, or supplementary materials included in this article.