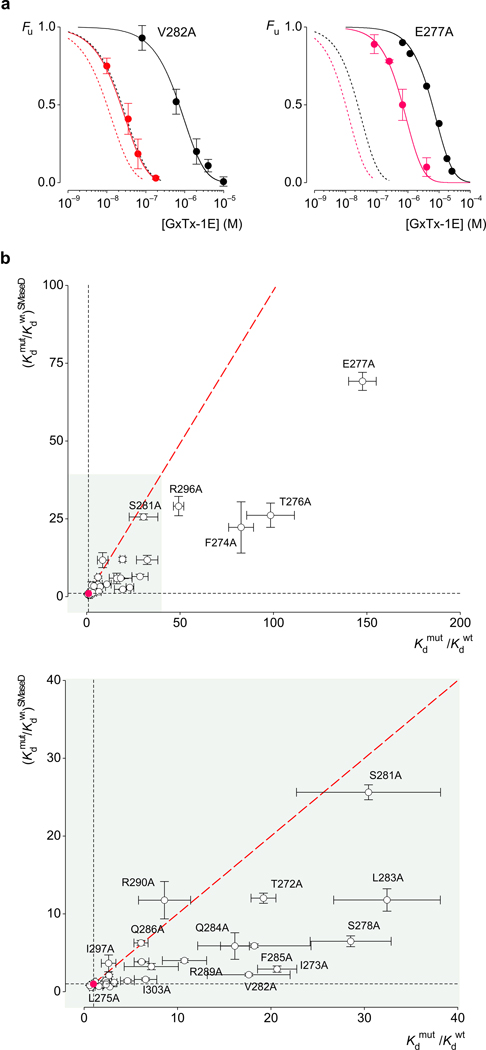
Figure 3.
Comparison of the effects of Kv2.1 paddle mutations on GxTx-1E affinity before and after membrane modification with SMaseD. (a) Concentration-dependence for GxTx-1E occupancy of V282A and E277A mutants of Kv2.1 before (black) and after (red) SMaseD treatment. The apparent Kd values are 3.8±0.4 µM and 120±9 nM for V282A, and 30±1.5 µM and 3.5±0.15 µM for E277A. The dotted lines represent the fits for the wild type channel data from Figure 2a. (b,c) Effects of mutations on toxin affinity (Kdmut/Kdwt) for control membranes plotted against that following treatment with SMaseD. The value for the wild type channel is indicated by the red circle. The red dotted line corresponds to identical perturbations for control and SMaseD-treated membranes (no coupling between the mutation and the lipid modification). Data from Supplementary Table 1. Each mutant was examined initially using a concentration of toxin near the Kd for the wild type; mutants with different Kd were further examined using a wider range of concentrations. n=3, error bars are s.e.m.

