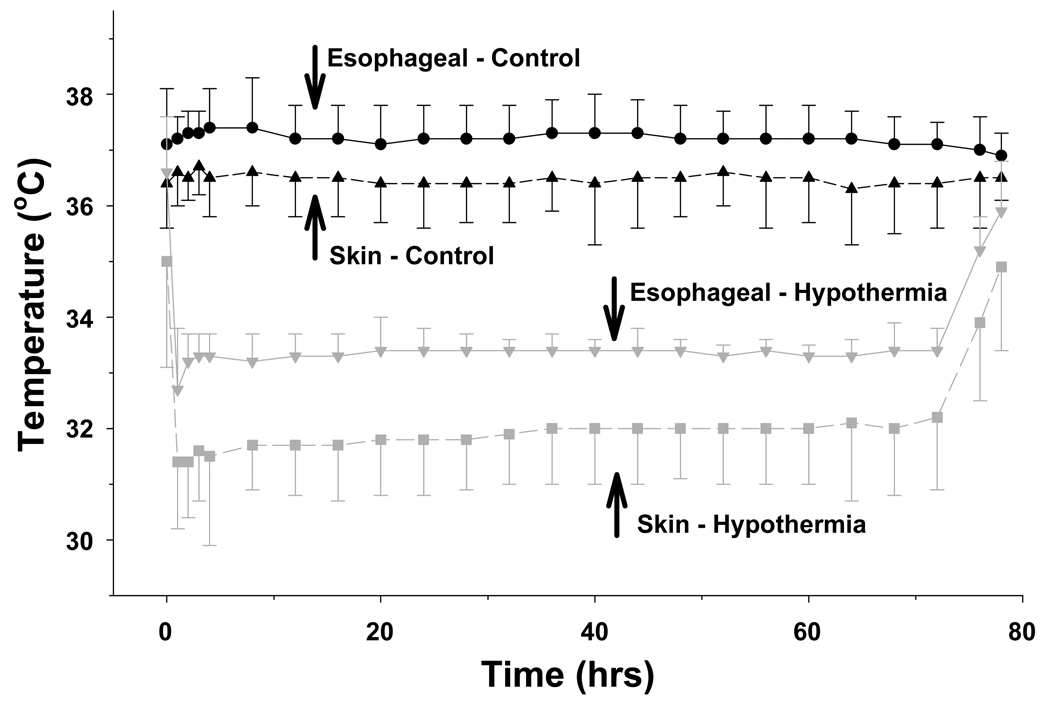
Figure I.
Esophageal and skin temperatures of both groups are plotted over the 72 hour interval of whole body cooling and subsequent rewarming. Symbols represent the mean and standard deviation. Control infants are represented by black symbols using circles for esophageal and triangles for skin temperature. Whole body cooling infants are represented by gray symbols using inverted triangles for esophageal and squares for skin temperature. Time 0 hours represents the initiation of body cooling in the intervention group.

